

Question: Show solution 3. The data shown in the following table represent the yearly amount of solar power in- stalled (in megawatts) in the United States
Show solution
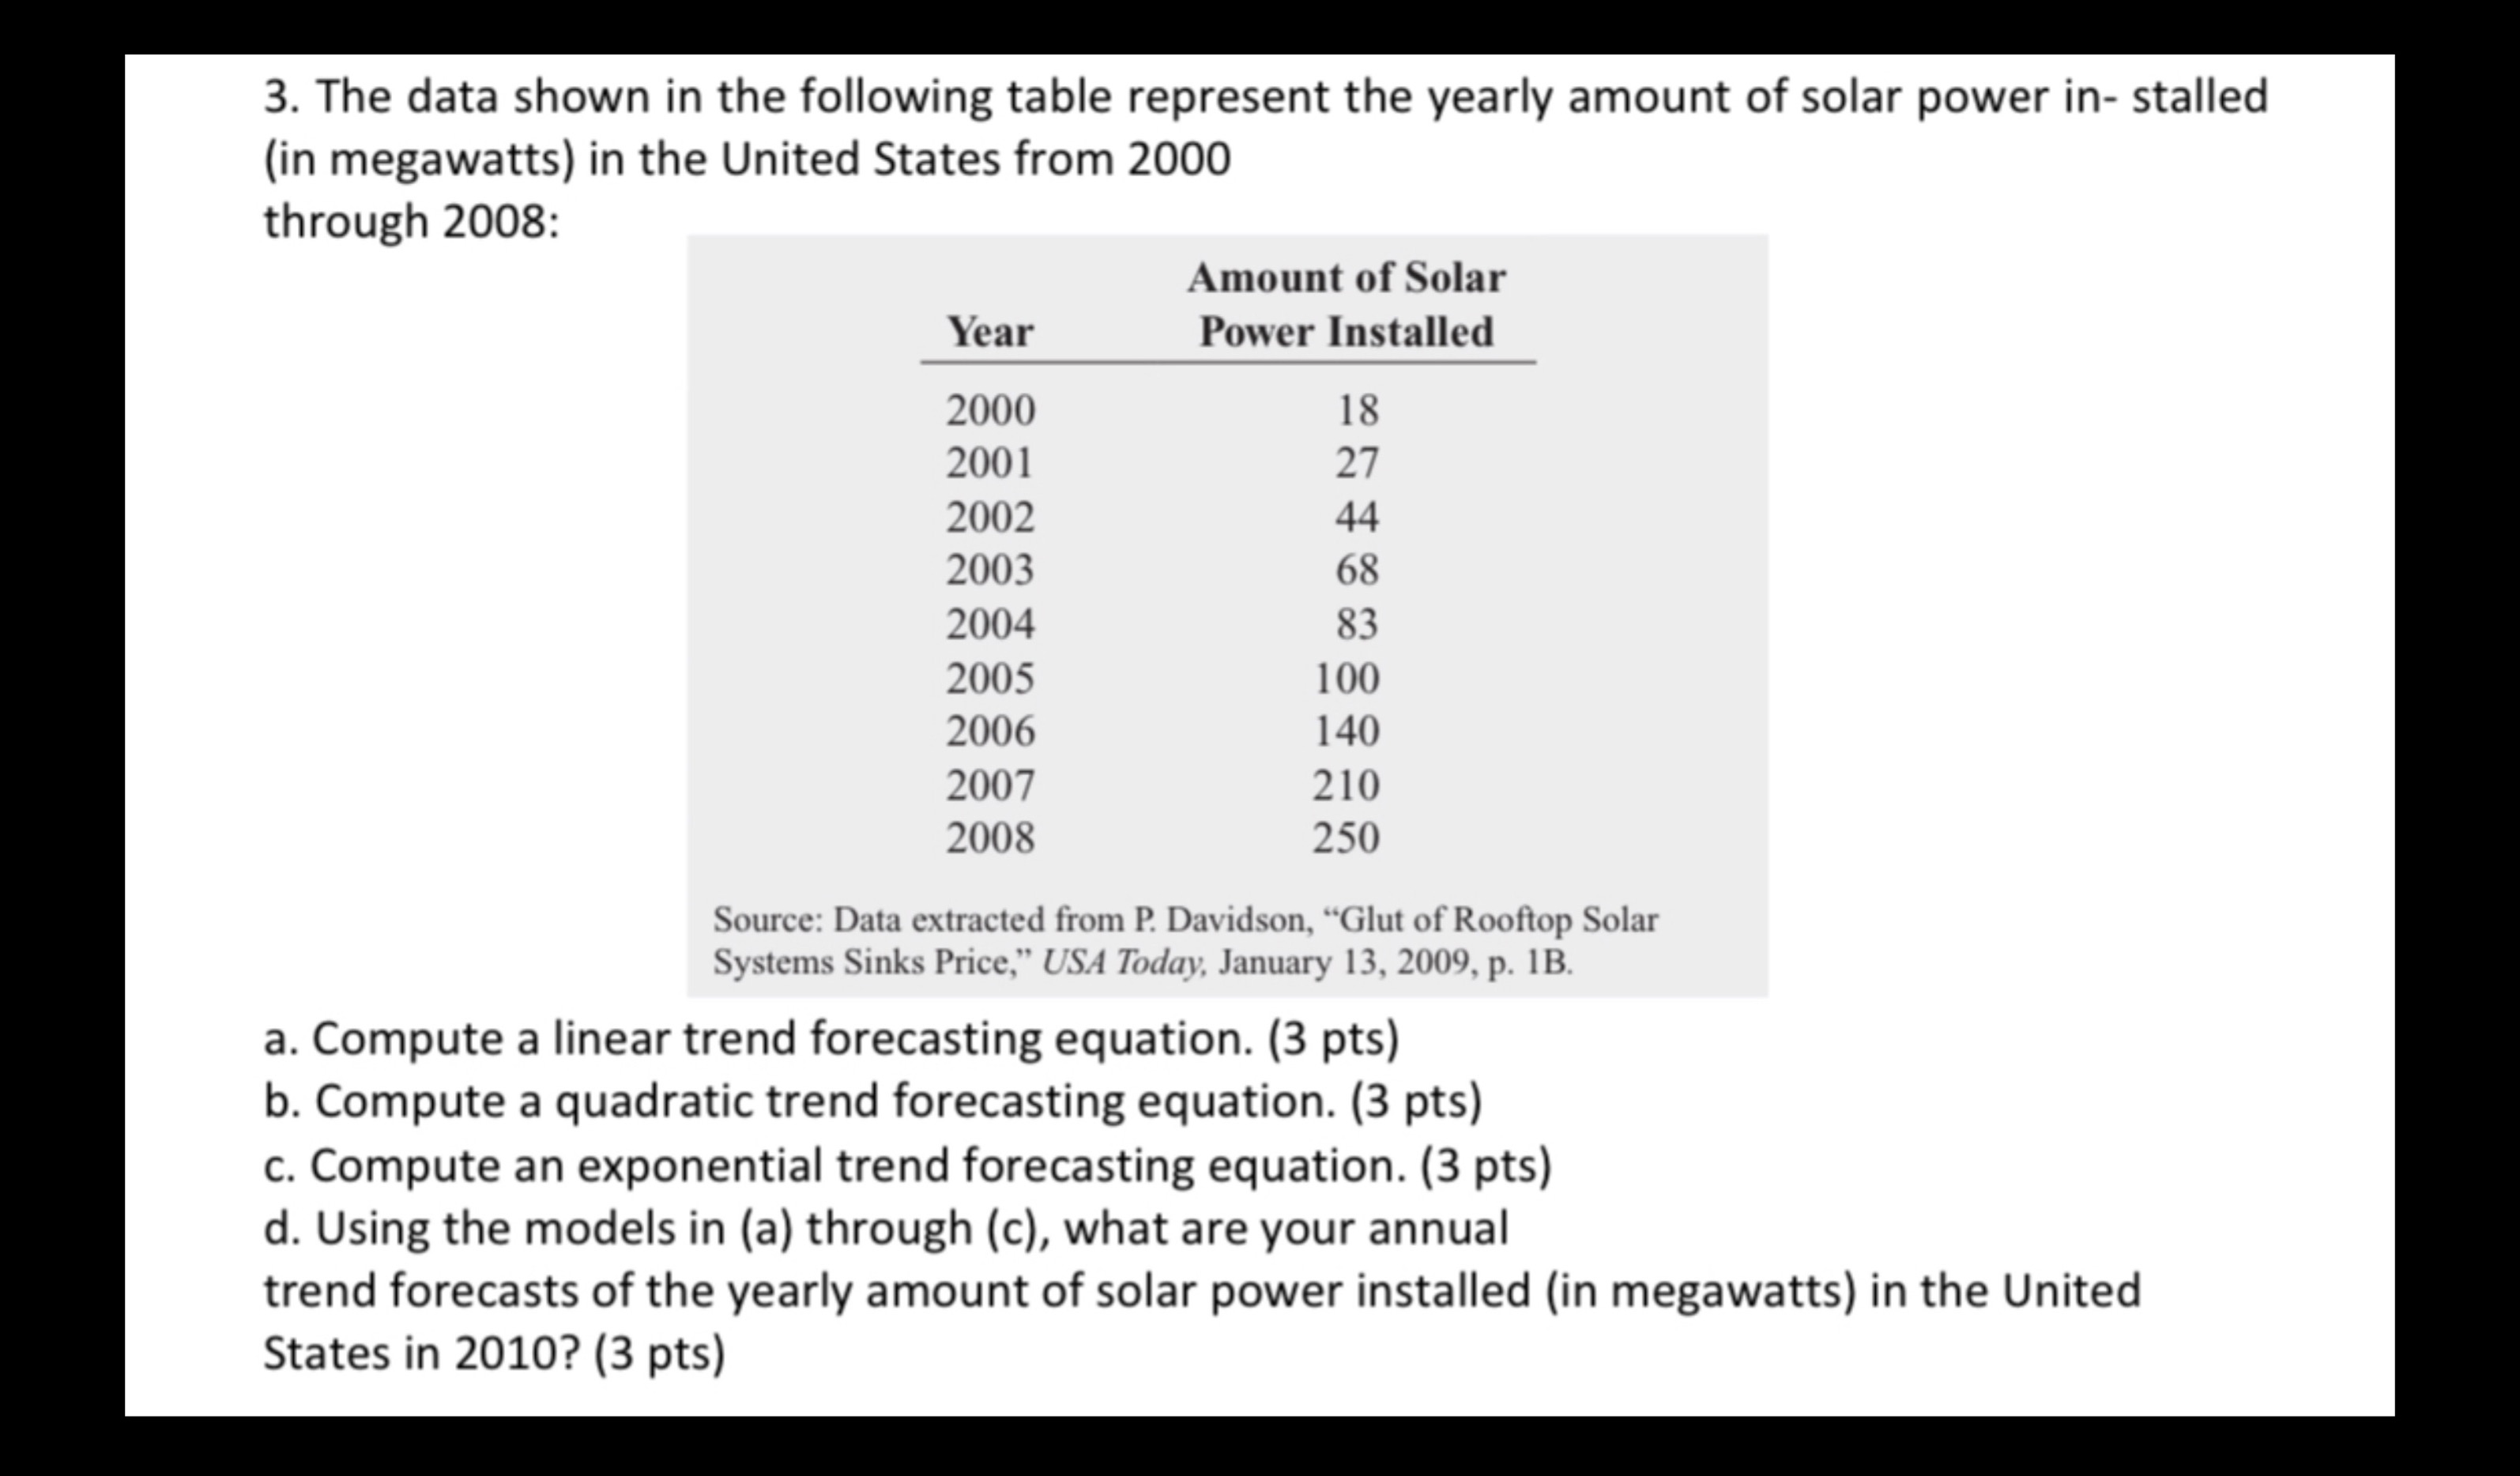
3. The data shown in the following table represent the yearly amount of solar power in- stalled (in megawatts) in the United States from 2000 through 2008: Amount of Solar Year Power Installed 2000 18 2001 27 2002 44 2003 68 2004 83 2005 100 2006 140 2007 210 2008 250 Source: Data extracted from P. Davidson, \"Glut of Rooftop Solar Systems Sinks Price." USA Todqv. January IS. 2009. p. 18. 3. Compute a linear trend forecasting equation. (3 pts) b. Compute a quadratic trend forecasting equation. (3 pts) c. Compute an exponential trend forecasting equation. (3 pts) d. Using the models in (a) through (c), what are your annual trend forecasts of the yearly amount of solar power installed (in megawatts) in the United States in 2010? (3 pts)
Step by Step Solution
There are 3 Steps involved in it

Get step-by-step solutions from verified subject matter experts