

Question: Show step by step on Excel 3. (Descriptive statistics) Here is the monthly stock price data for Ford and GM: A B 1 PRICES FOR
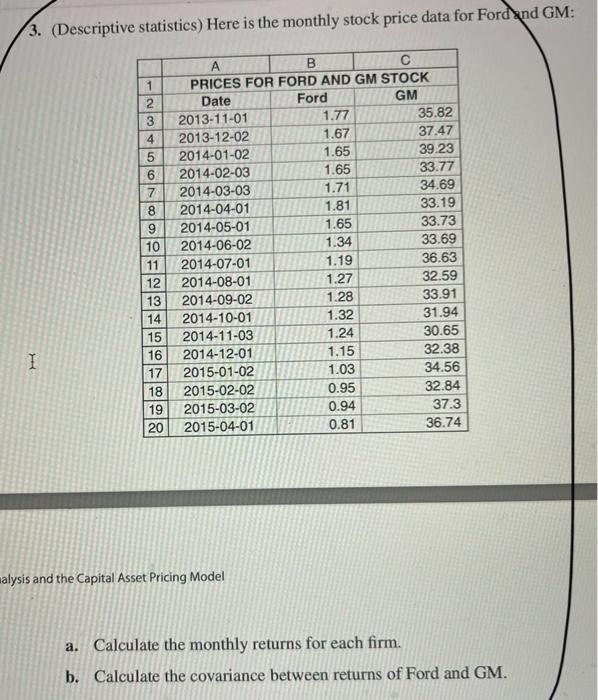
3. (Descriptive statistics) Here is the monthly stock price data for Ford and GM: A B 1 PRICES FOR FORD AND GM STOCK 2 Date Ford GM 3 2013-11-01 1.77 35.82 4 2013-12-02 1.67 37.47 5 2014-01-02 1.65 39.23 6 2014-02-03 1.65 33.77 2014-03-03 1.71 34.69 8 2014-04-01 1.81 33.19 9 2014-05-01 1.65 33.73 10 2014-06-02 1.34 33.69 11 2014-07-01 1.19 36.63 12 2014-08-01 1.27 32.59 13 2014-09-02 1.28 33.91 14 2014-10-01 1.32 31.94 15 2014-11-03 1.24 30.65 16 2014-12-01 1.15 I 32.38 17 2015-01-02 1.03 34.56 18 2015-02-02 0.95 32.84 19 2015-03-02 0.94 37.3 20 2015-04-01 0.81 36.74 malysis and the Capital Asset Pricing Model a. Calculate the monthly returns for each firm. b. Calculate the covariance between returns of Ford and GM
Step by Step Solution
There are 3 Steps involved in it

Get step-by-step solutions from verified subject matter experts