

Question: Show the CVP AND BEP GRAPHICALLY MEANING HOW DO I GRAPH THAT with the info on the pic ble Recommended Table Pictures Shapes SmartArt Screenshot
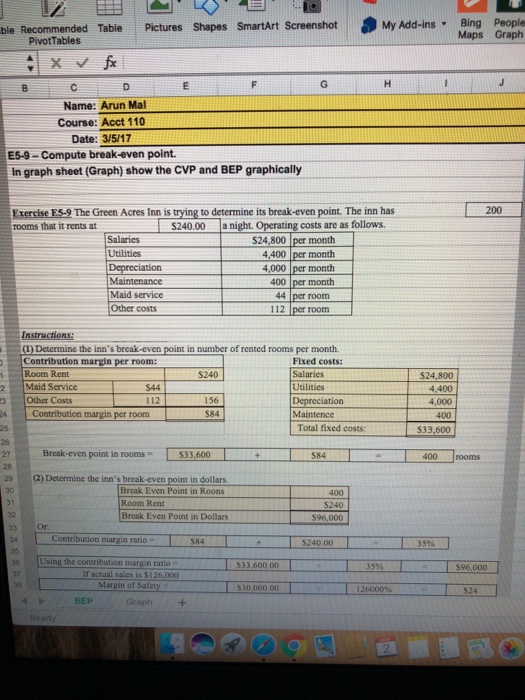
ble Recommended Table Pictures Shapes SmartArt Screenshot My Add-ins Bing People Maps Graph PivotTables Name: Arun Mal Course: Acct 110 Date: 3/5/17 E5-9-Compute break-even point In graph sheet (Graph) show the CVP and BEP graphically 200 Exercise ES-9 The Green Acres Inn is trying to determine its break-even point. The inn has rooms that it rents at $240.00 a night. Operating costs are as follows. S24,800 per month 4,400 per month 4,000 per month 400 per month 44 per room Utilities Maid service Other costs Instru 1) Determine the inn's break-even point in number of rented rooms per month. Contribution margin per room: Room Rent 2Maid Service 3Other Costs Fixed costs: Salaries Utilities $240 $44 112 S24,800 4.400 4,000 156 $84 Contribution margin per footm Maintence Total fixed costs: S33,600 26 Break-even point in rooms 584 400 rooms 29(2) Determine the inn's break-even point in dollars 30 Break Even Point in Roons Room Rent Break Even Point in Dollars S240 $96,000 Or Contribution margin ratio S84 S240.00 35% Using the contribution margin ratio 533,600.00 596,000 Margin of Safety 530,000.00 $24 BEP Graph
Step by Step Solution
There are 3 Steps involved in it

Get step-by-step solutions from verified subject matter experts