

Question: Show the steps, in excel Plot a chart showing the relationship between Investment in IT and revenues using the data in the Table below, and
Show the steps, in excel
Plot a chart showing the relationship between Investment in IT and revenues using the data in the Table below, and calculate the correlation between IT investment and revenue
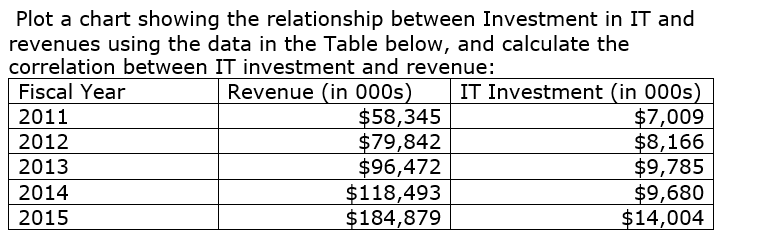
Plot a chart showing the relationship between Investment in IT and revenues using the data in the Table below, and calculate the correlation between IT investment and revenue: Fiscal Year Revenue (in 000s) IT Investment (in 000s) 2011 $58,345 $7,009 2012 $79,842 $8,166 2013 $96,472 $9,785 2014 $118,493 $9,680 2015 $184,879 $14,004
Step by Step Solution
There are 3 Steps involved in it
1 Expert Approved Answer
Step: 1 Unlock

Question Has Been Solved by an Expert!
Get step-by-step solutions from verified subject matter experts
Step: 2 Unlock
Step: 3 Unlock