

Question: show work excel please Given the sample data below, we are creating a Xbar and s chart. Calculates the sample standard deviation for subgroup 1.
show work excel please
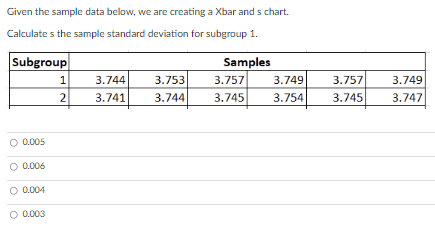
Given the sample data below, we are creating a Xbar and s chart. Calculates the sample standard deviation for subgroup 1. Subgroup Samples 1 3.744 3.753 3.741 3.744 0.005 0.006 0.004 0.003 NT 2 3.757 3.745 3.749 3.757 3.754 3.745 3.749 3.747Step by Step Solution
There are 3 Steps involved in it
1 Expert Approved Answer
Step: 1 Unlock

Question Has Been Solved by an Expert!
Get step-by-step solutions from verified subject matter experts
Step: 2 Unlock
Step: 3 Unlock