

Question: show work in excel We have this data from our process Each subgroup has 6 samples. We have already calculated the Xbar ands for each
show work in excel
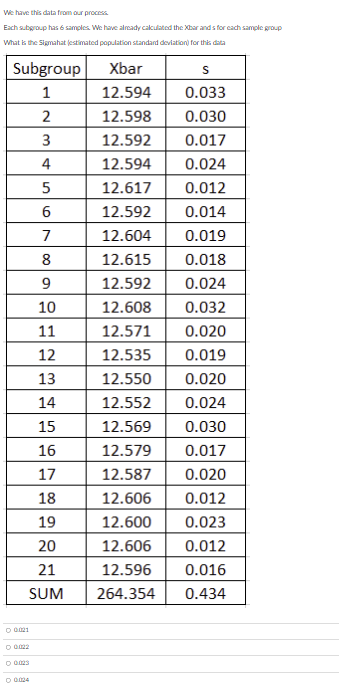
We have this data from our process Each subgroup has 6 samples. We have already calculated the Xbar ands for each sample group What is the Sigmahat (estimated population standard deviation) for this data Subgroup Xbar S 1 12.594 0.033 2 12.598 0.030 3 12.592 0.017 4 12.594 0.024 5 12.617 0.012 6 12.592 0.014 12.604 0.019 12.615 0.018 12.592 0.024 12.608 0.032 12.571 0.020 12.535 0.019 12.550 0.020 12.552 0.024 12.569 0.030 12.579 0.017 12.587 0.020 12.606 0.012 12.600 0.023 12.606 0.012 12.596 0.016 264.354 0.434 7 8 9 10 11 12 13 14 15 16 17 18 19 20 21 SUM 0 0.021 O 0022 O 0023 O 0024Step by Step Solution
There are 3 Steps involved in it
1 Expert Approved Answer
Step: 1 Unlock

Question Has Been Solved by an Expert!
Get step-by-step solutions from verified subject matter experts
Step: 2 Unlock
Step: 3 Unlock