

Question: Show your code in excel or wolfram mathematica only Generate the plot of spectral energy density vs frequency and spectral energy density vs wavelength for
Show your code in excel or wolfram mathematica only
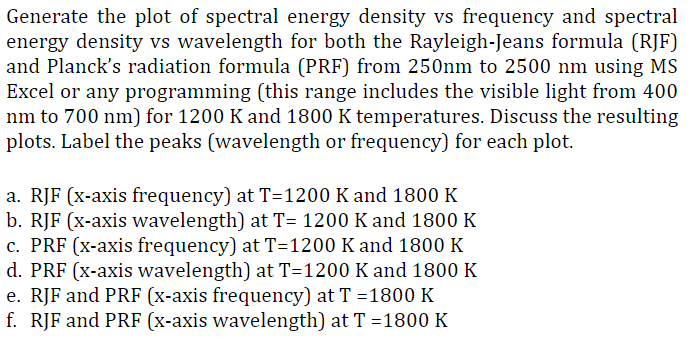
Generate the plot of spectral energy density vs frequency and spectral energy density vs wavelength for both the Rayleigh-Jeans formula (RJF) and Planck's radiation formula (PRF) from 250nm to 2500nm using MS Excel or any programming (this range includes the visible light from 400 nm to 700nm ) for 1200K and 1800K temperatures. Discuss the resulting plots. Label the peaks (wavelength or frequency) for each plot. a. RJF (x-axis frequency) at T=1200K and 1800K b. RJF (x-axis wavelength) at T=1200K and 1800K c. PRF (x-axis frequency) at T=1200K and 1800K d. PRF ( x-axis wavelength) at T=1200K and 1800K e. RJF and PRF ( x-axis frequency) at T=1800K f. RJF and PRF (x-axis wavelength) at T=1800K
Step by Step Solution
There are 3 Steps involved in it

Get step-by-step solutions from verified subject matter experts