

Question: SHOW YOUR WORK PLEASE! See Table showing financial statement data and stock price data for Mydeco Corp. a. Compute Mydeco's PE ratio each year from
SHOW YOUR WORK PLEASE!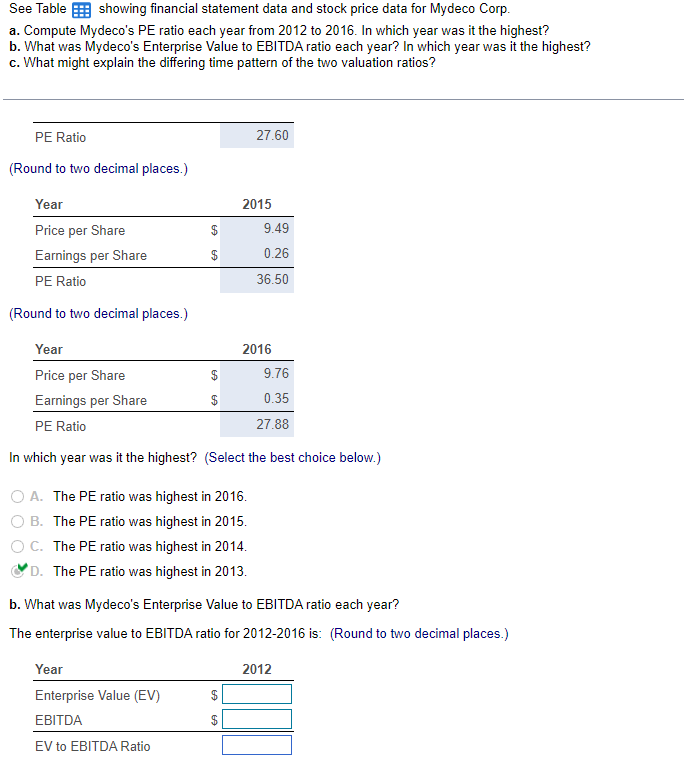
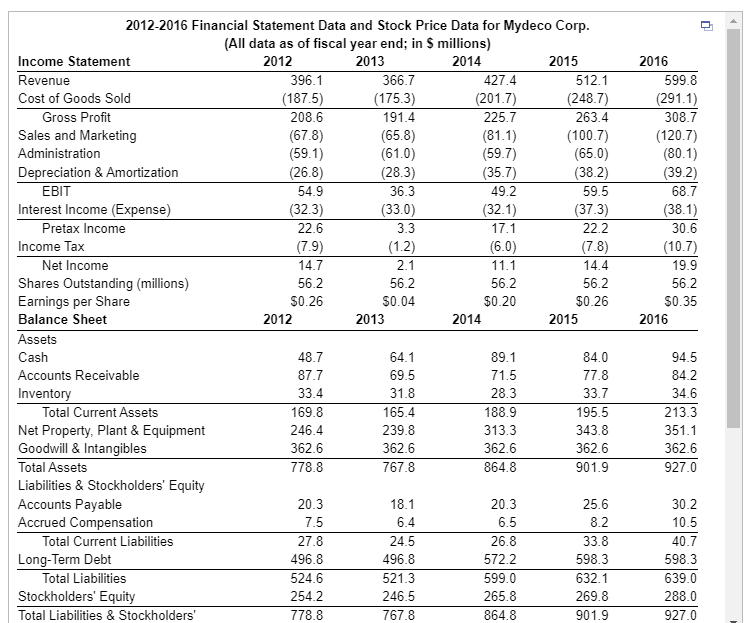
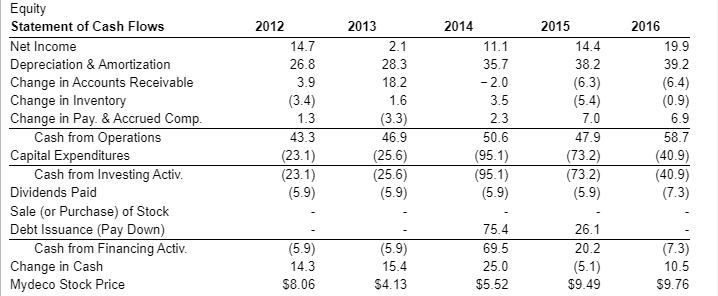
See Table showing financial statement data and stock price data for Mydeco Corp. a. Compute Mydeco's PE ratio each year from 2012 to 2016 . In which year was it the highest? b. What was Mydeco's Enterprise Value to EBITDA ratio each year? In which year was it the highest? c. What might explain the differing time pattern of the two valuation ratios? (Round to two decimal places.) (Round to two decimal places.) In which year was it the highest? (Select the best choice below.) A. The PE ratio was highest in 2016. B. The PE ratio was highest in 2015 . C. The PE ratio was highest in 2014 . 'D. The PE ratio was highest in 2013. b. What was Mydeco's Enterprise Value to EBITDA ratio each year? The enterprise value to EBITDA ratio for 20122016 is: (Round to two decimal places.) 2012-2016 Financial Statement Data and Stock Price Data for Mydeco Corp. Equity
Step by Step Solution
There are 3 Steps involved in it

Get step-by-step solutions from verified subject matter experts