

Question: Shown are three normal probability plots. Which one suggests data comes from a normal distribution? Normal Probability Plot A Normal Probability Plot 3 Normal Probability
Shown are three normal probability plots. Which one suggests data comes from a normal distribution?
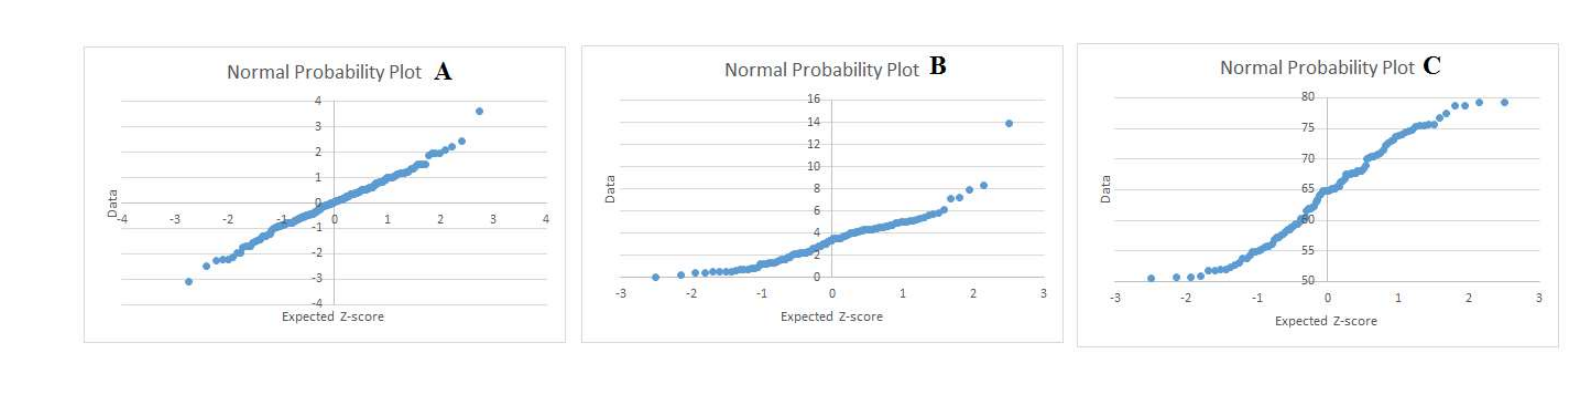
Normal Probability Plot A Normal Probability Plot 3 Normal Probability Plot C 4 . 15. so u. . 5.. 14 1- 127 m E , 7- 5 3 l; \"i 5 . 3 " ' 4 a nu - -3 -2 4 o 1 2 s .5 2
Step by Step Solution
There are 3 Steps involved in it
1 Expert Approved Answer
Step: 1 Unlock

Question Has Been Solved by an Expert!
Get step-by-step solutions from verified subject matter experts
Step: 2 Unlock
Step: 3 Unlock