

Question: Shown below are the scatter plots for four different data sets. Answer the questions that follow. The same response may be the correct answer for
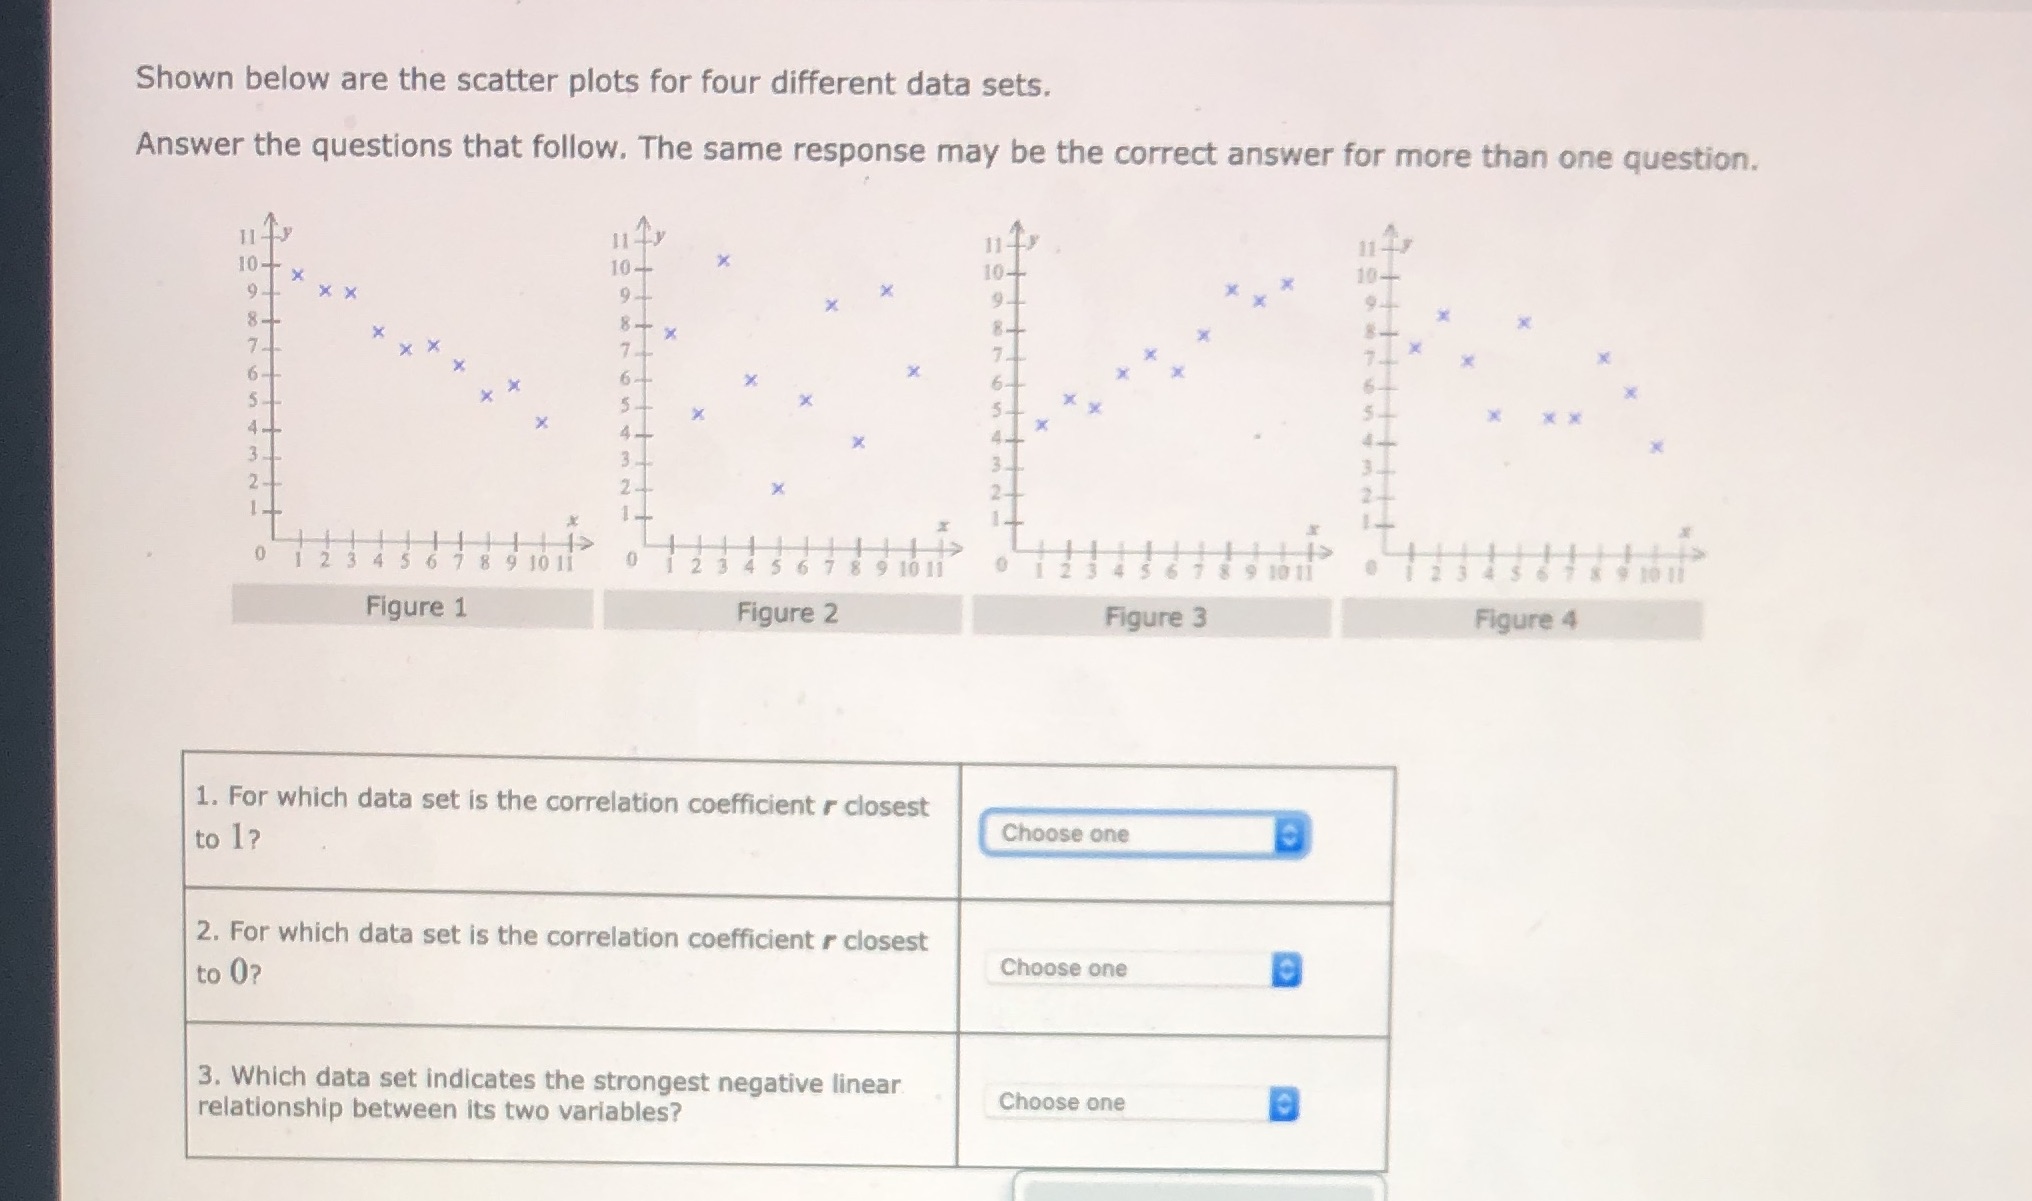
Shown below are the scatter plots for four different data sets. Answer the questions that follow. The same response may be the correct answer for more than one question. 10- 10 4 X 10- 104 9 X 7 7 6- X X 4 X NW 2 _ X 0 123 1234 56 7 8 9 1011 Figure 1 Figure 2 Figure 3 Figure 4 1. For which data set is the correlation coefficient r closest to 1? Choose one 2. For which data set is the correlation coefficient r closest to 0? Choose one 3. Which data set indicates the strongest negative linear relationship between its two variables? Choose one
Step by Step Solution
There are 3 Steps involved in it
1 Expert Approved Answer
Step: 1 Unlock

Question Has Been Solved by an Expert!
Get step-by-step solutions from verified subject matter experts
Step: 2 Unlock
Step: 3 Unlock