

Question: Shown below are the scatter plots for four different data sets. Answer the questions that follow. The same response may be the correct answer for
Shown below are the scatter plots for four different data sets.
Answer the questions that follow. The same response may be the correct answer for more than one question.
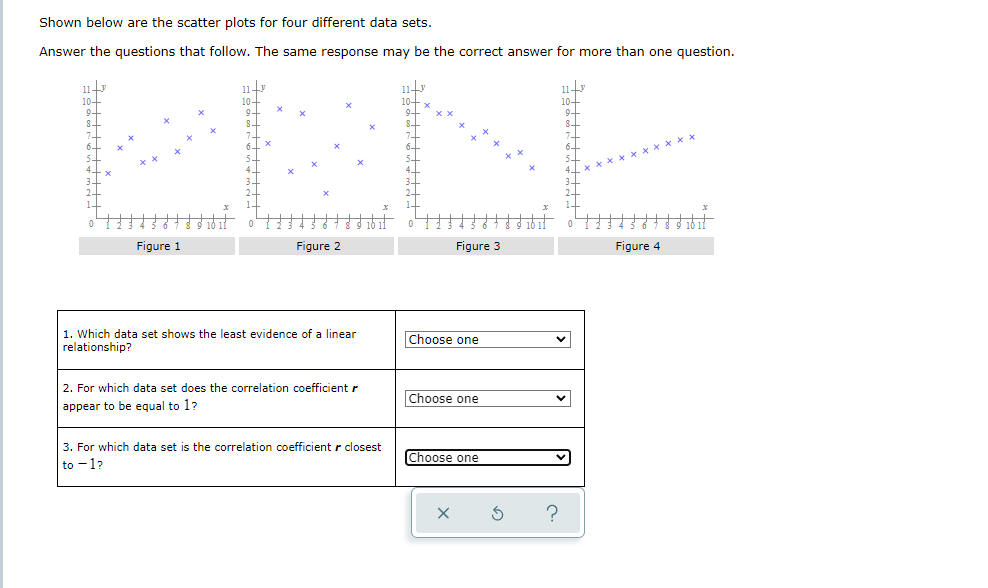
Shown below are the scatter plots for four different data sets. Answer the questions that follow. The same response may be the correct answer for more than one question. 11 - 11 -J 11 -J 10- 10 10- x 10- K X 9_ 6_ 61 7 6- X 4_ 41 4_ 3- 3- 3- 3- 2- 2- 2- Figure 1 Figure 2 Figure 3 Figure 4 1. Which data set shows the least evidence of a linear relationship? Choose one 2. For which data set does the correlation coefficient r v appear to be equal to 1? Choose one 3. For which data set is the correlation coefficient r closest to - 1? Choose one v X 5
Step by Step Solution
There are 3 Steps involved in it

Get step-by-step solutions from verified subject matter experts