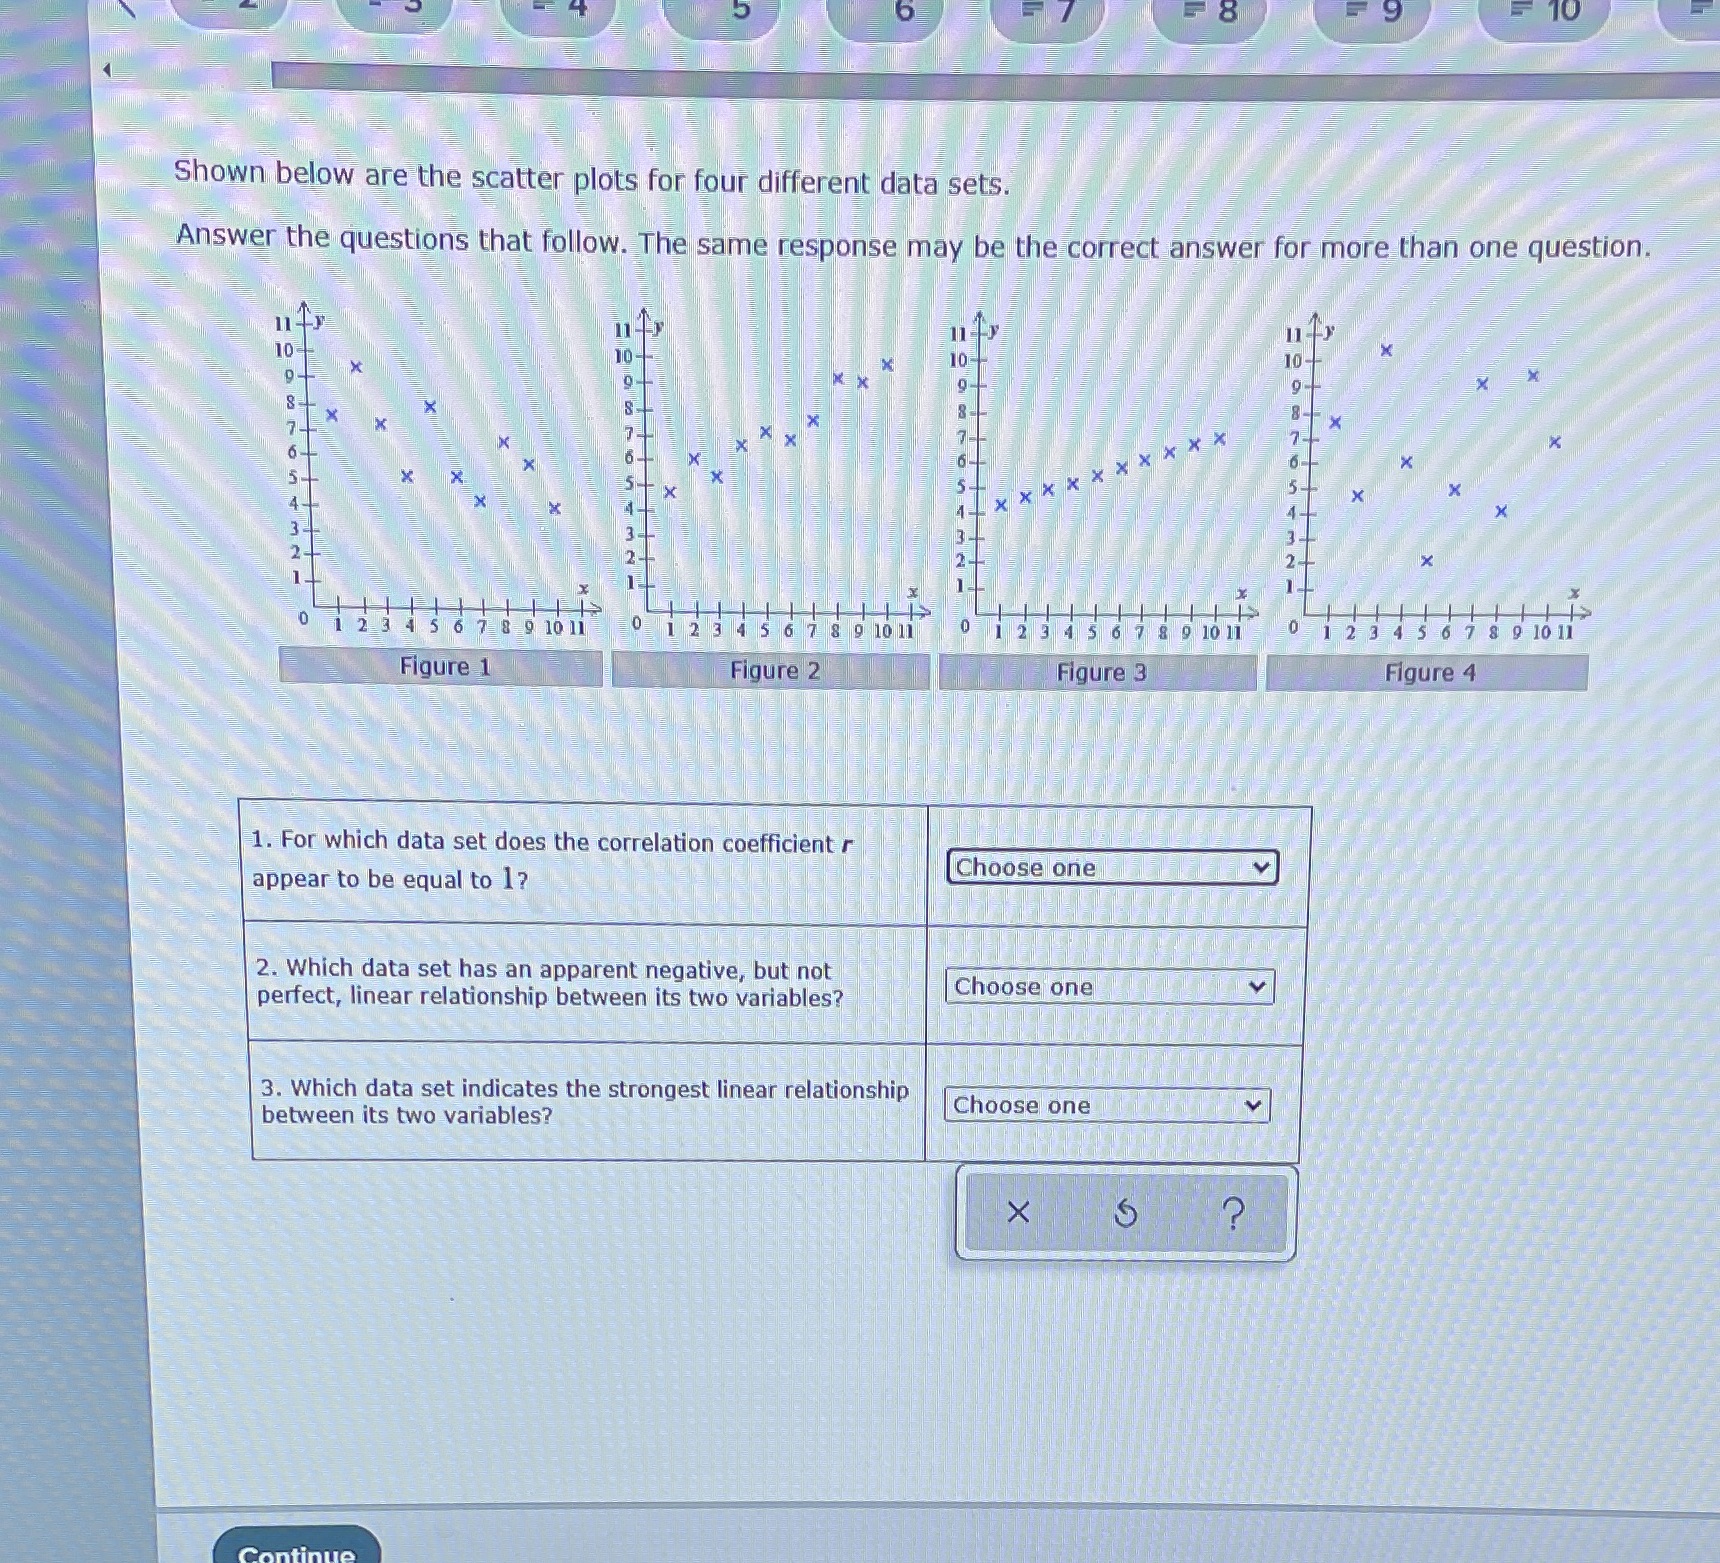
Question: Shown below are the scatter plots for four different data sets. Answer the questions that follow. The same response may be the correct answer for

Shown below are the scatter plots for four
Shown below are the scatter plots for four different data sets. Answer the questions that follow. The same response may be the correct answer for more than one question. 10 - 10- 3- 3-+ 1 2 3 4 5 6 7 8 9 10 11 0 12 3 4 5 6 7 8 9 10 1 1 0 123 4 5 6 7 8 9 10 11 0 1 2 3 4 5 6 7 8 9 10 11 Figure 1 Figure 2 Figure 3 Figure 4 1. For which data set does the correlation coefficient r Choose one appear to be equal to 1? 2. Which data set has an apparent negative, but not perfect, linear relationship between its two variables? Choose one 3. Which data set indicates the strongest linear relationship between its two variables? Choose one X

Step by Step Solution

There are 3 Steps involved in it

1 Expert Approved Answer
Step: 1 Unlock blur-text-image
Question Has Been Solved by an Expert!

Get step-by-step solutions from verified subject matter experts

Step: 2 Unlock
Step: 3 Unlock

Students Have Also Explored These Related Mathematics Questions!