

Question: Shown is a position versus time graph for a car moving in a straight line with a constant velocity. What is the velocity of the
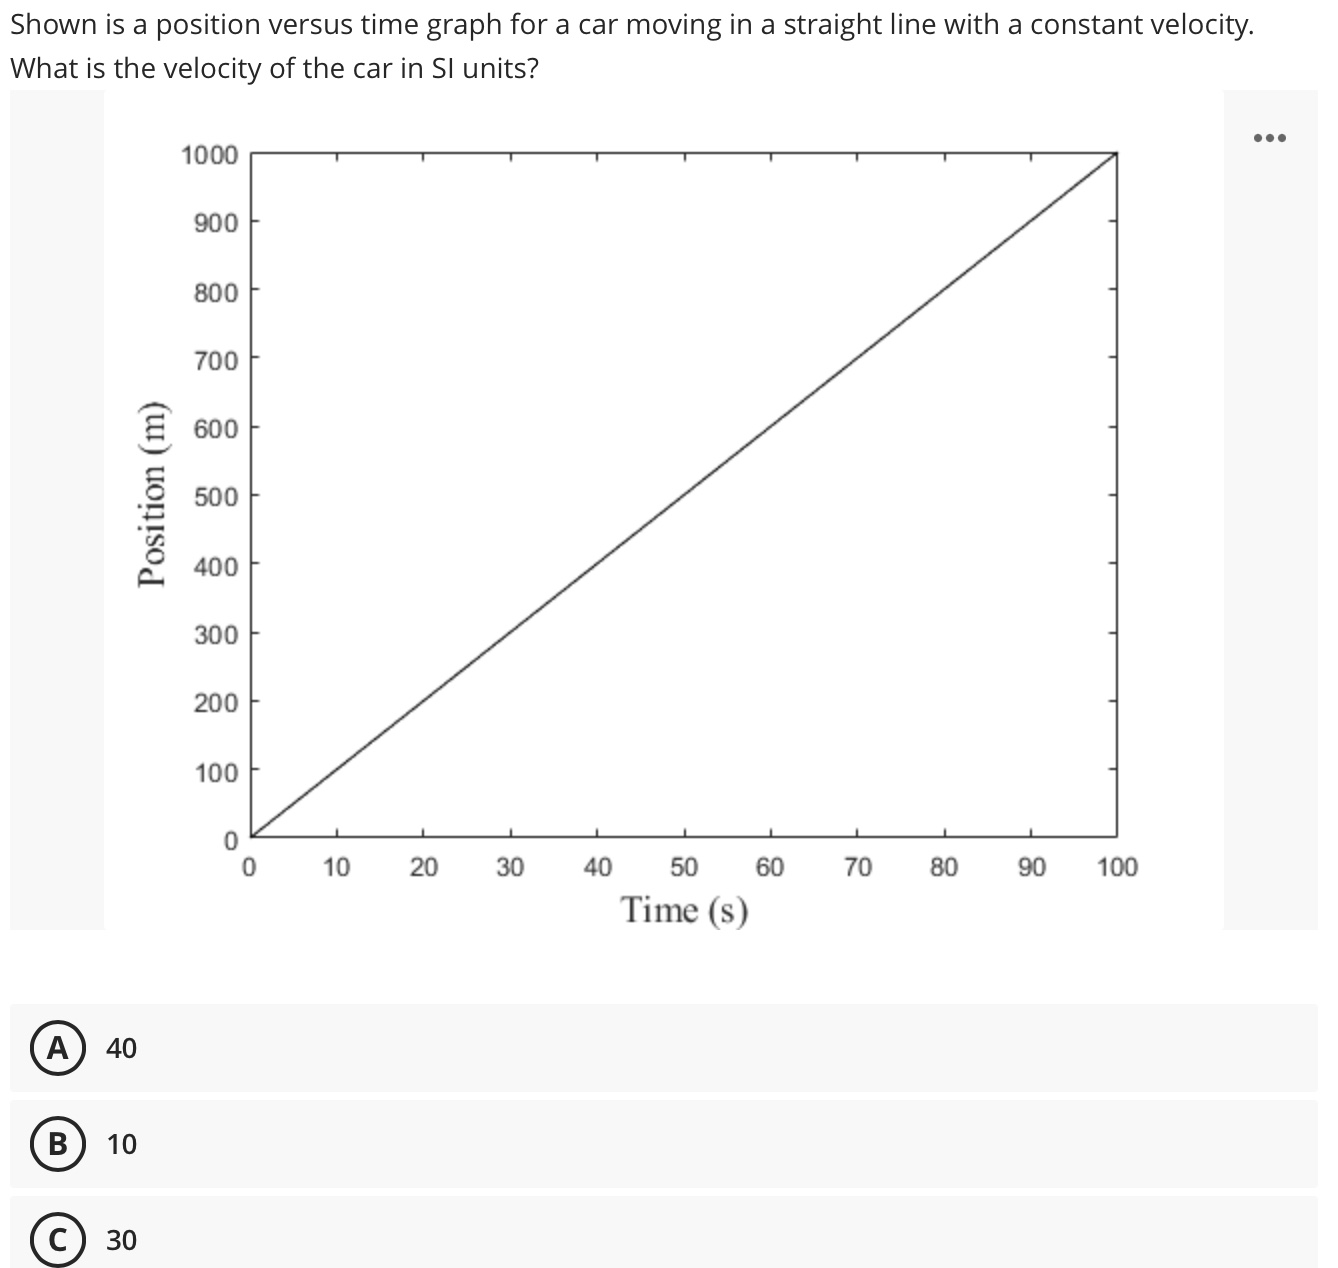
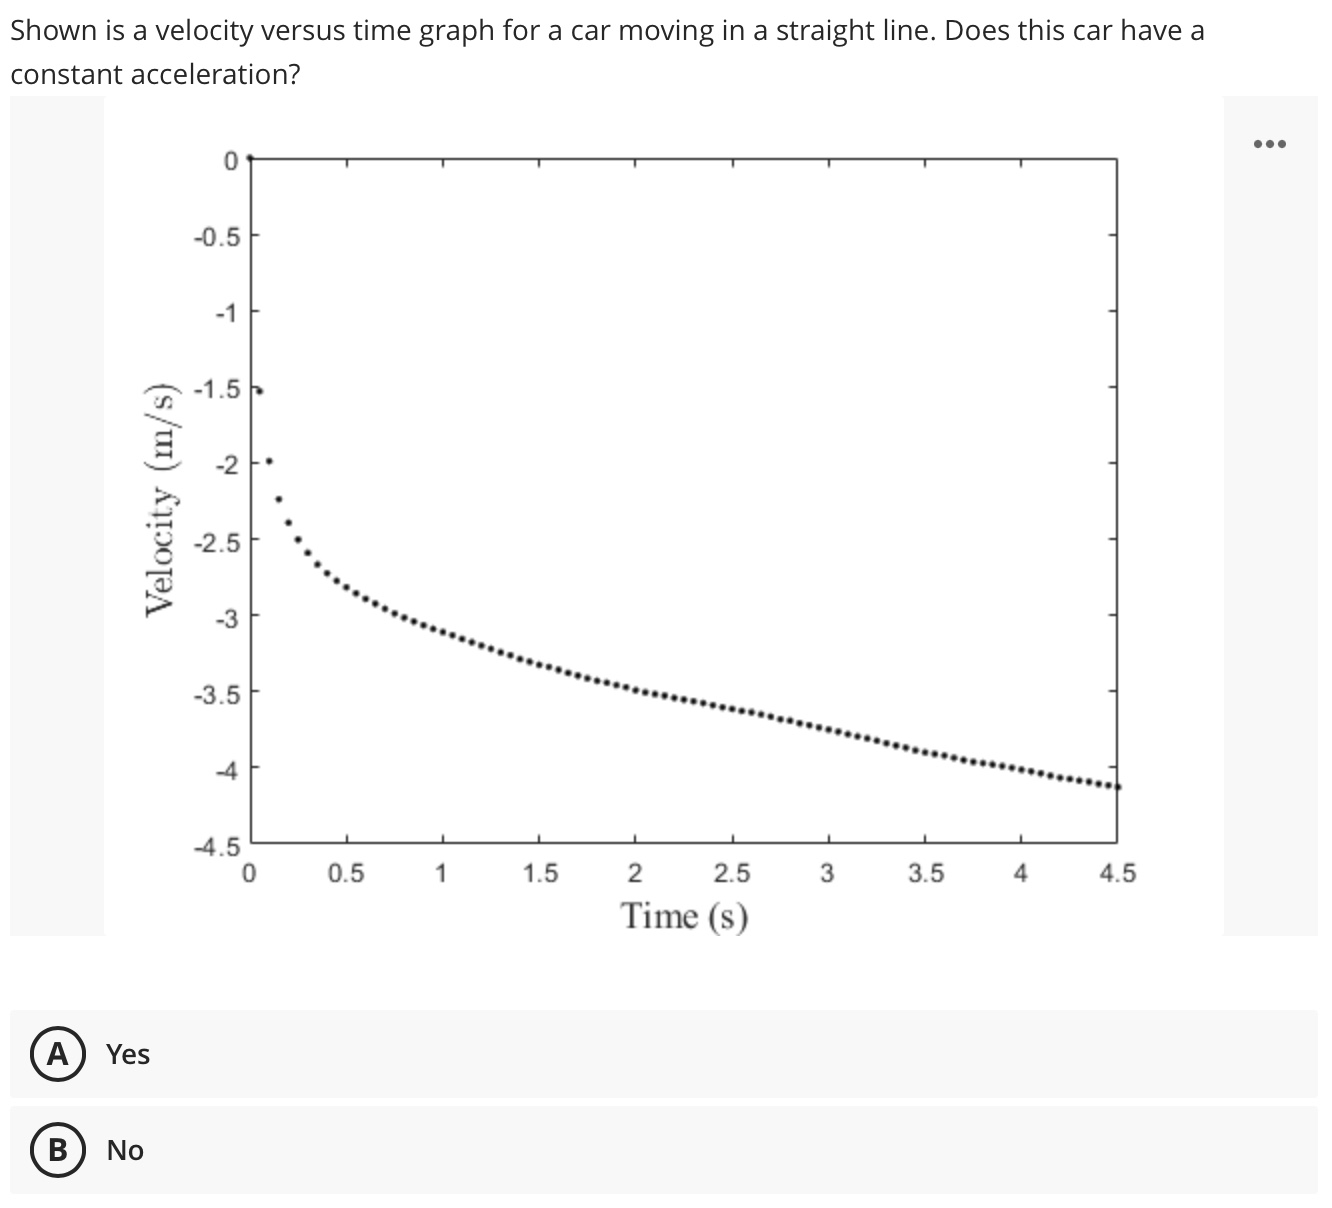
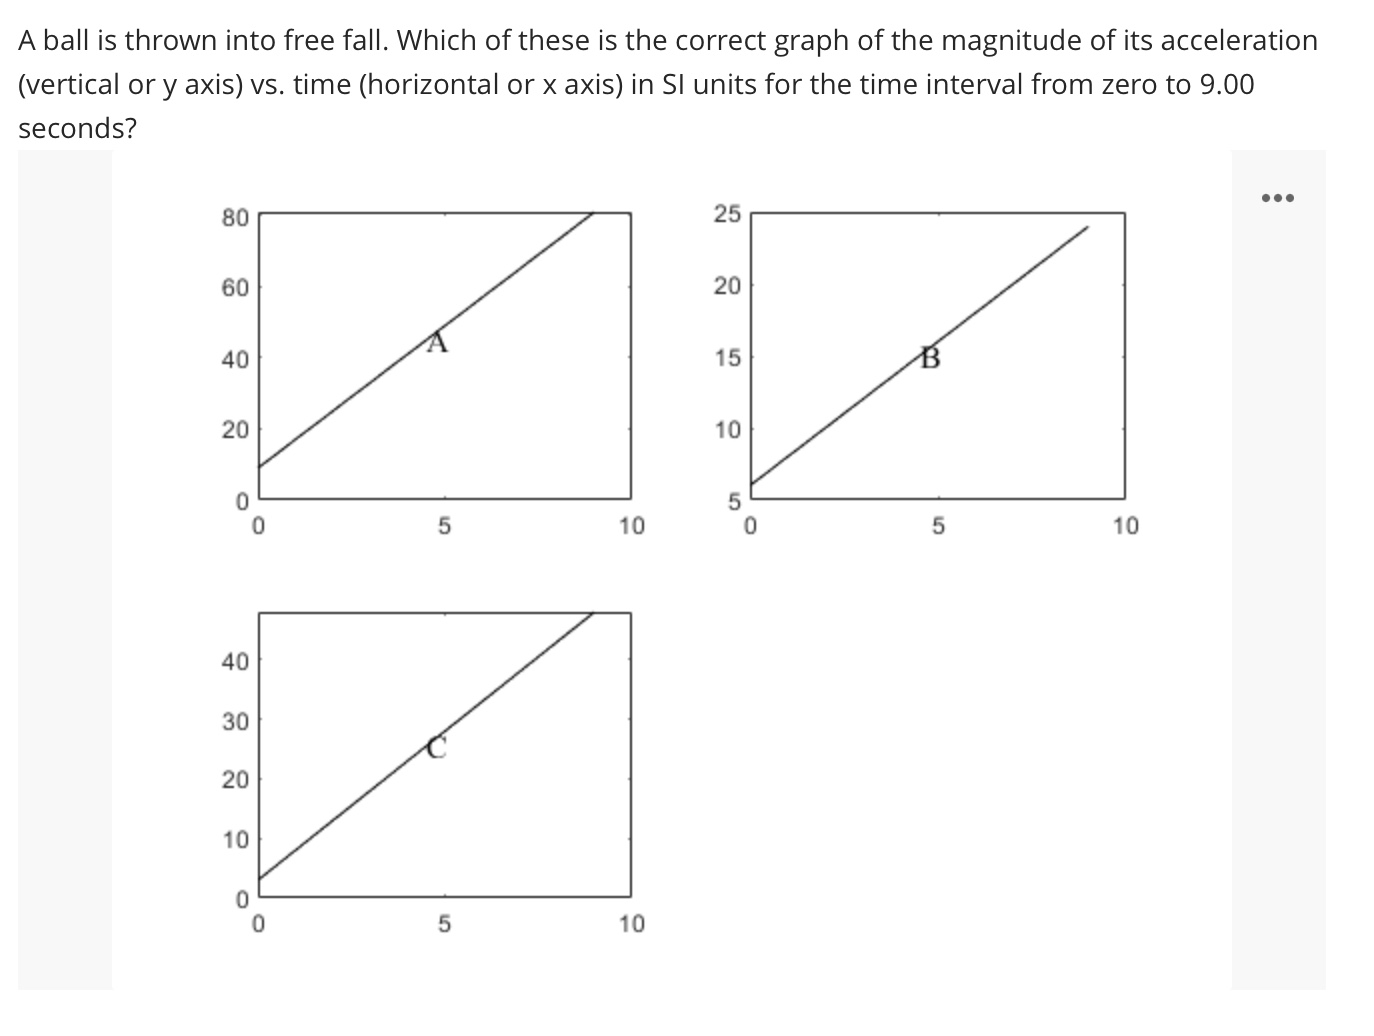
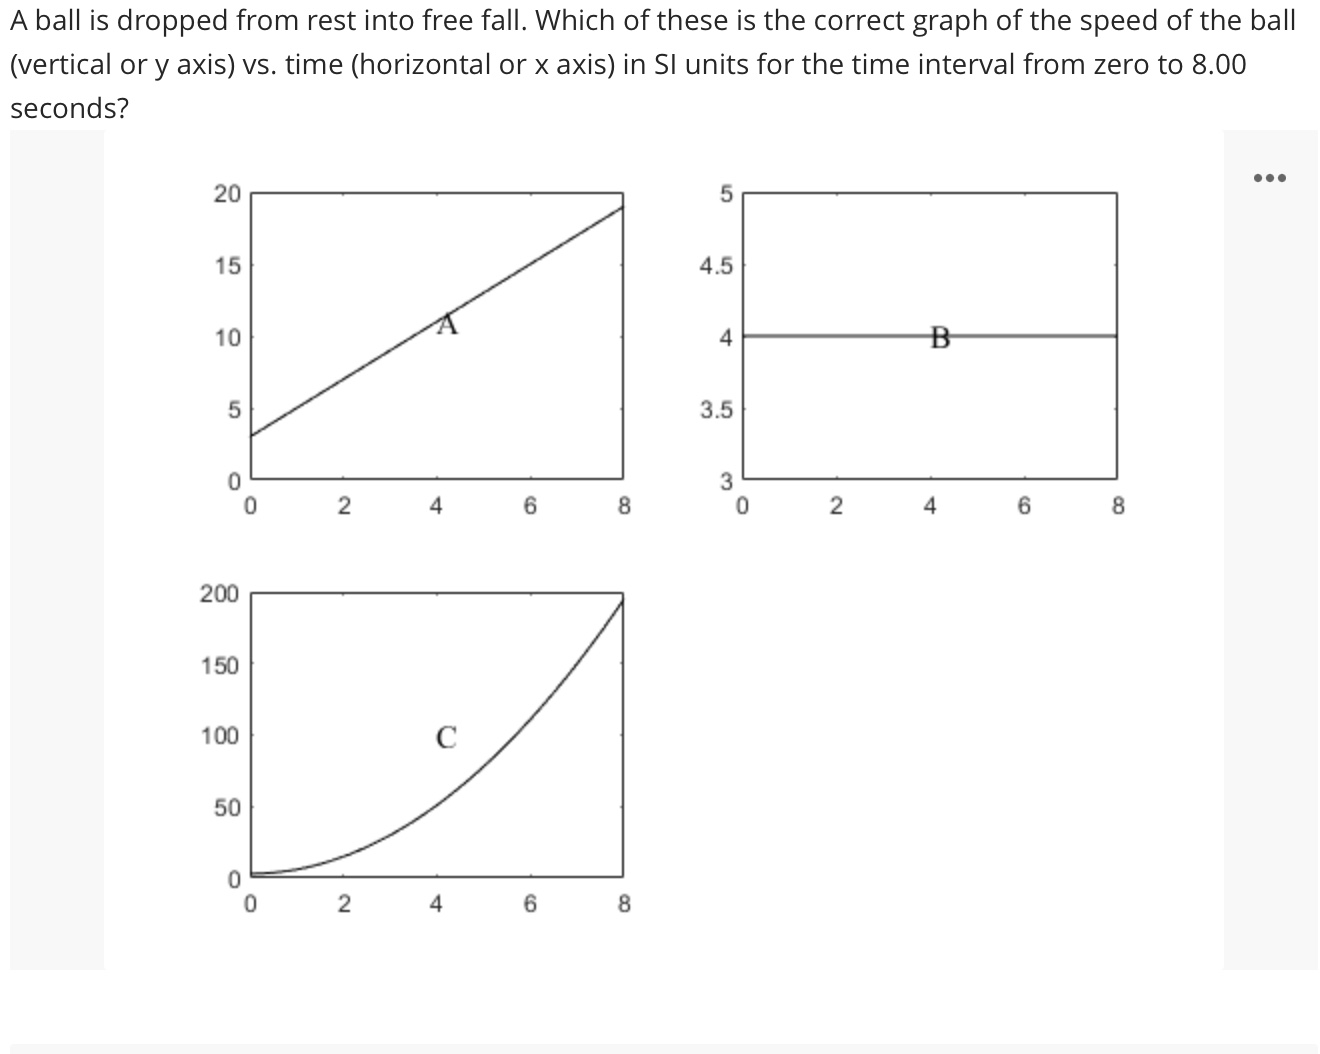
Shown is a position versus time graph for a car moving in a straight line with a constant velocity. What is the velocity of the car in SI units? ... 1000 900 800 700 600 Position (m) 500 400 300 200 100 10 20 30 40 50 60 70 80 90 100 Time (s) A 40 10 C 30Shown is a velocity versus time graph for a car moving in a straight line. Does this car have a constant acceleration? Velocity (\"155) ' 0 0.5 1 1.5 2 2.5 3 3.5 4 4.5 Time [3) Yes A ball is thrown into free fall. Which of these is the correct graph of the magnitude of its acceleration (vertical or y axis) vs. time (horizontal or x axis) in SI units for the time interval from zero to 9.00 seconds? 80 25 . . . 60 20 40 15 B 20 10 5 10 0 5 10 40 30 20 10 5 10A ball is dropped from rest into free fall. Which ofthese is the correct graph of the speed of the ball (vertical or y axis) vs. time (horizontal or x axis) in SI units for the time interval from zero to 8.00 seconds? 20 5 15 4.5 10 4 5 3.5 0 3 0 2 4 6 8 0 2 4 6 8 200 150 100 50 D
Step by Step Solution
There are 3 Steps involved in it

Get step-by-step solutions from verified subject matter experts