

Question: Simple Regression Models Using your results from Case Study No. 1, discuss whether there is evidence any violations of the following model assumptions for the
- Simple Regression Models
- Using your results from Case Study No. 1, discuss whether there is evidence any violations of the following model assumptions for the preferred model, including discussing the specific output or analysis used to evaluate potential violations of assumptions:
- Linearity assumption.
- Equal variance (homoscedasticity) assumption.
- Endogeneity assumption.
- Using your results from Case Study No. 1, discuss whether there is evidence any violations of the following model assumptions for the preferred model, including discussing the specific output or analysis used to evaluate potential violations of assumptions:

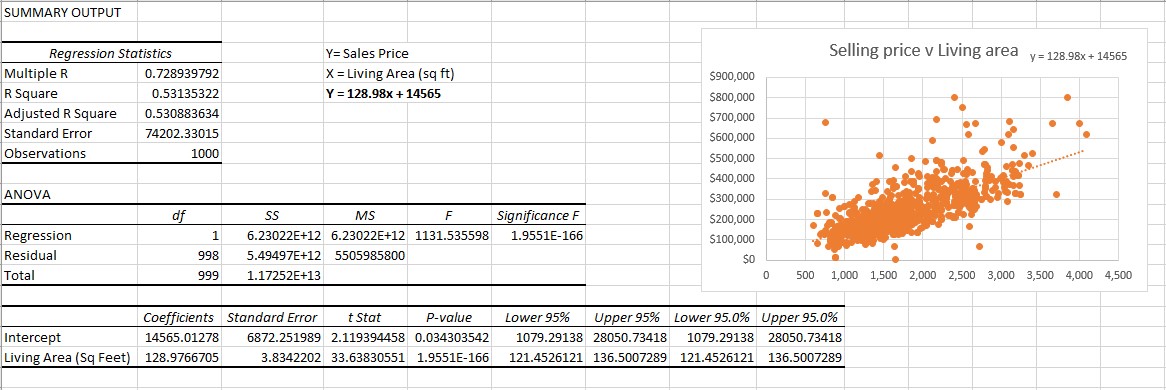
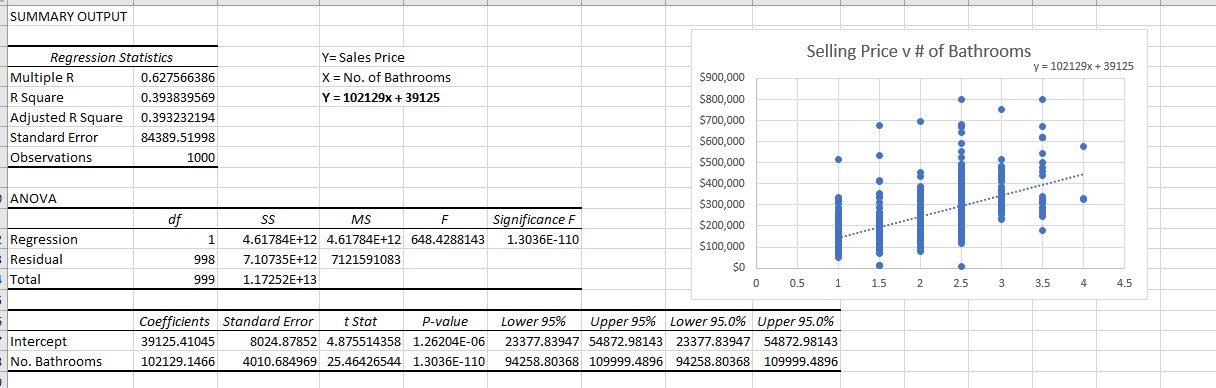
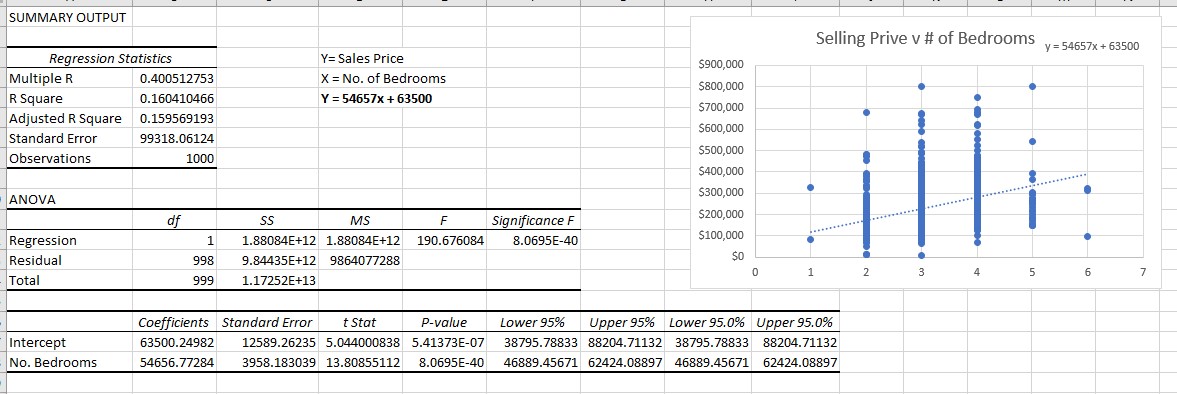
SUMMARY OUTPUT Regression Statistics Y= Sales Price Selling price v Living area y= 128.98x + 14565 Multiple R 0.728939792 X = Living Area (sq ft) $900,000 R Square 0.53135322 Y = 128.98x + 14565 5800,000 Adjusted R Square 0.530883634 $700,000 Standard Error 74202.33015 $600,000 Observations 1000 $500,000 $400,000 ANOVA $300,000 df SS MS F Significance F $200,000 Regression 1 6.23022E+12 6.23022E+12 1131.535598 1.9551E-166 $100,000 Residual 998 5.49497E+12 5505985800 50 Total 999 1.17252E+13 0 500 1,000 1,500 2,000 2,500 3,000 3,500 4,000 4,500 Coefficients Standard Error t Stat P-value Lower 95% Upper 95% Lower 95.0% Upper 95.0% Intercept 14565.01278 6872.251989 2.119394458 0.034303542 1079.29138 28050.73418 1079.29138 28050.73418 Living Area (Sq Feet) | 128.9766705 3.8342202 33.63830551 1.9551E-166 121.4526121 136.5007289 121.4526121 136.5007289SUMMARY OUTPUT Regression Statistics Y= Sales Price Selling price v Living area y= 128.98x + 14565 Multiple R 0.728939792 X = Living Area (sq ft) $900,000 R Square 0.53135322 Y = 128.98x + 14565 5800,000 Adjusted R Square 0.530883634 $700,000 Standard Error 74202.33015 $600,000 Observations 1000 $500,000 $400,000 ANOVA $300,000 df SS MS F Significance F $200,000 Regression 1 6.23022E+12 6.23022E+12 1131.535598 1.9551E-166 $100,000 Residual 998 5.49497E+12 5505985800 50 Total 999 1.17252E+13 0 500 1,000 1,500 2,000 2,500 3,000 3,500 4,000 4,500 Coefficients Standard Error t Stat P-value Lower 95% Upper 95% Lower 95.0% Upper 95.0% Intercept 14565.01278 6872.251989 2.119394458 0.034303542 1079.29138 28050.73418 1079.29138 28050.73418 Living Area (Sq Feet) | 128.9766705 3.8342202 33.63830551 1.9551E-166 121.4526121 136.5007289 121.4526121 136.5007289SUMMARY OUTPUT Regression Statistics Y= Sales Price Selling Price v # of Bathrooms y = 102129x + 39125 Multiple R 0.627566386 X = No. of Bathrooms $900,000 R Square 0.393839569 Y =102129x + 39125 $800,000 Adjusted R Square 0.393232194 $700,000 Standard Error 84389.51998 $600,000 Observations 1000 $500,000 $400,000 ANOVA $300,000 df SS MS F Significance F $200,000 Regression 1 4.61784E+12 4.61784E+12 648.4288143 1.3036E-110 $100,000 Residual 998 7.10735E+12 7121591083 50 Total 999 1.17252E+13 0 0.5 1 1.5 2 2.5 3 3.5 4 4.5 Coefficients Standard Error t Stat P-value Lower 95% Upper 95% Lower 95.0% Upper 95.0% Intercept 39125.41045 8024.87852 4.875514358 1.26204E-06 23377.83947 54872.98143 23377.83947 54872.98143 No. Bathrooms 102129.1466 4010.684969 25.46426544 1.3036E-110 94258.80368 109999.4896 94258.80368 109999.4896SUMMARY OUTPUT Selling Prive v # of Bedrooms y = 54657x + 63500 Regression Statistics Y= Sales Price $900,000 Multiple R 0.400512753 X = No. of Bedrooms 5800,000 R Square 0.160410466 Y =54657x + 63500 $700,000 Adjusted R Square 0.159569193 $600,000 Standard Error 99318.06124 $500,000 Observations 1000 $400,000 $300,000 ANOVA df SS MS F Significance F $200,000 Regression 1 1.88084E+12 1.88084E+12 190.676084 8.0695E-40 $100,000 Residual 998 9.84435E+12 9864077288 50 0 1 2 4 5 6 7 Total 999 1.17252E+13 Coefficients Standard Error t Stat P-value Lower 95% Upper 95% Lower 95.0% Upper 95.0% Intercept 63500.24982 12589.26235 5.044000838 5.41373E-07 38795.78833 88204.71132 38795.78833 88204.71132 No. Bedrooms 54656.77284 3958.183039 13.80855112 8.0695E-40 46889.45671 62424.08897 46889.45671 62424.08897
Step by Step Solution
There are 3 Steps involved in it

Get step-by-step solutions from verified subject matter experts