

Question: Sin theta graph sinB bt g 0~ 200 400 600 800~ (M The graph in the figure above is for a diffraction grating, showing sin
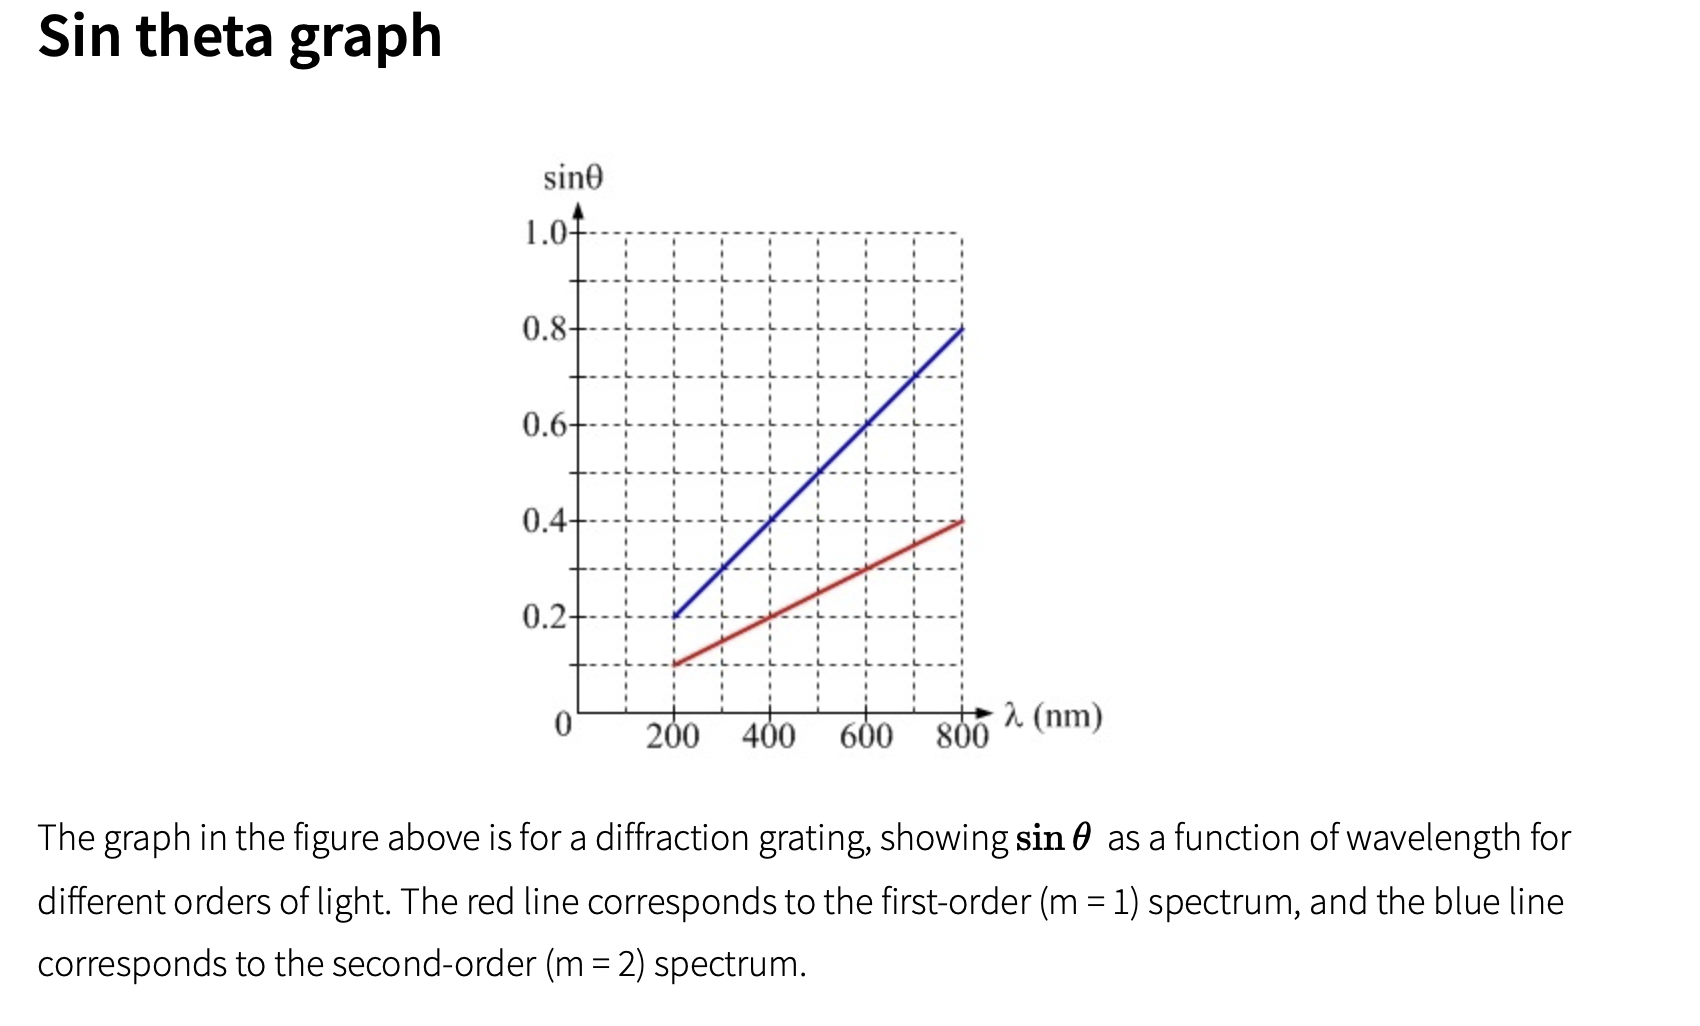

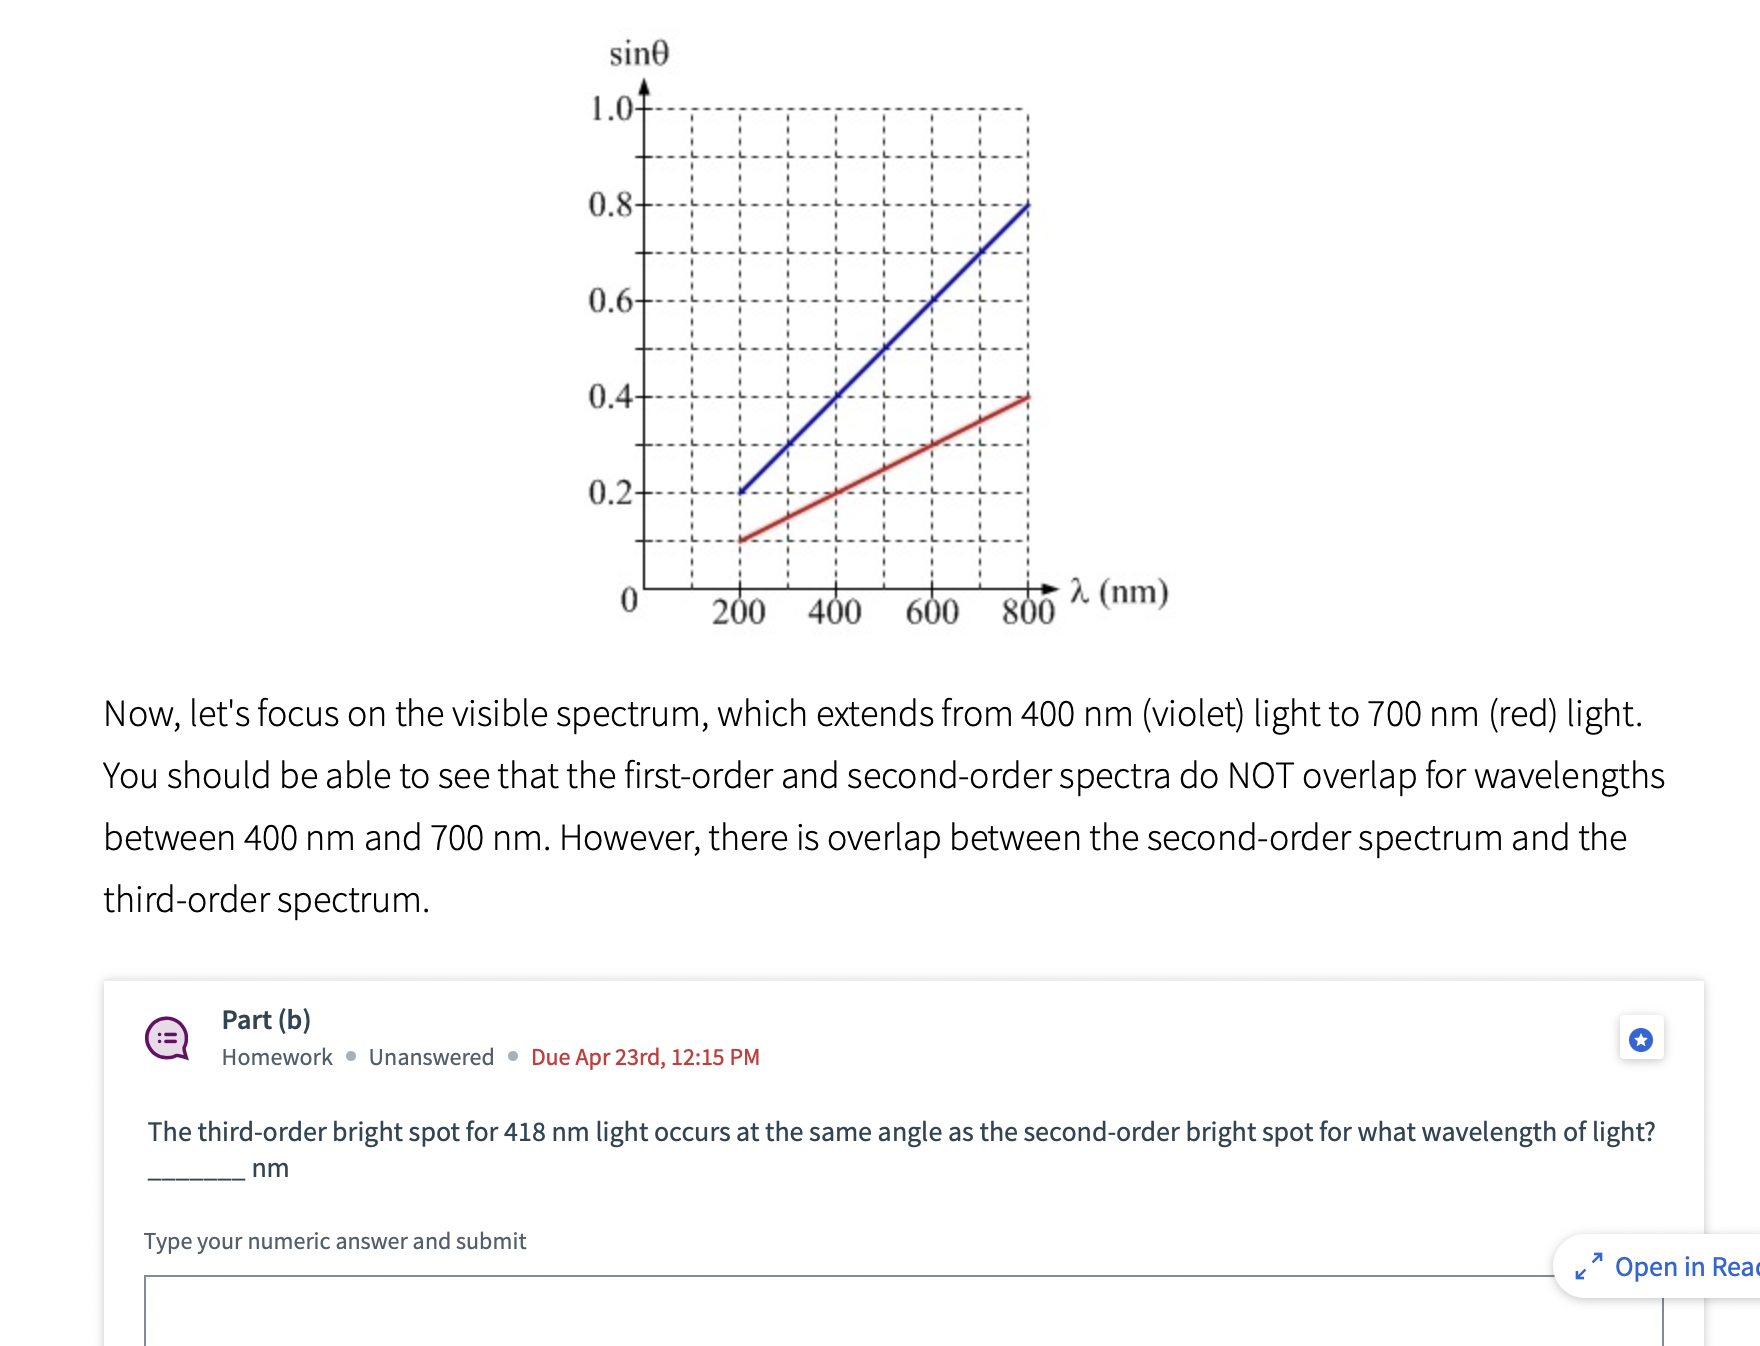
Sin theta graph sinB bt g 0~ 200 400 600 800~ (M The graph in the figure above is for a diffraction grating, showing sin as a function of wavelength for different orders of light. The red line corresponds to the first-order (m = 1) spectrum, and the blue line corresponds to the second-order (m = 2) spectrum. @ Part (a) o Homework Unanswered Due Apr23rd, 12:15 PM At what angle is the third-order bright spot for 418 nm light? Type your numeric answer and submit Unanswered e 5 attempts left
Step by Step Solution
There are 3 Steps involved in it
1 Expert Approved Answer
Step: 1 Unlock

Question Has Been Solved by an Expert!
Get step-by-step solutions from verified subject matter experts
Step: 2 Unlock
Step: 3 Unlock