

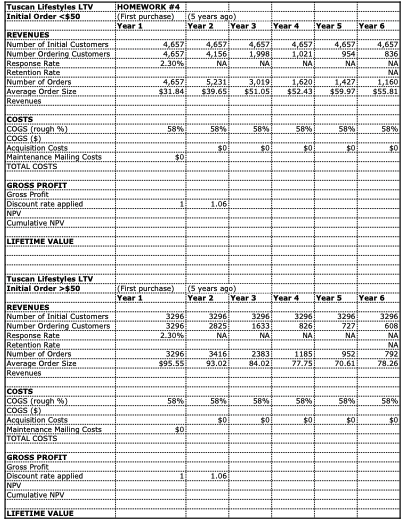
Question: Since the average initial purchase was $ 5 8 , the analyst rounded down to $ 5 0 and used that to divide the 7
Since the average initial purchase was $ the analyst rounded down to $ and used that to
divide the new customers into two groups: those whose initial purchase was less than $
and those whose initial purchase was $ or more. Of the total, there were that made an
initial purchase less than $ and with an initial purchase of at least $
Next, for each group he tracked the number of repeat purchases in each of their first years as
a customer of Tuscan Lifestyles. In any given year, there were some who did not make a repeat
purchase and some who made one or more repeat purchases. Exhibits and summarize
these results. In any given frequency table, the first column represents the total number of
purchases made, the second column represents the number of customers who made the
corresponding number of purchases. In interpreting these exhibits, note that # orders years
ago reflects orders placed during customers first year as a customer, # orders years ago
reflect orders placed during customers second year as a customer, and that # orders last year
reflect orders placed during customers fifth year as a customer.
Finally, for each of the two groups the analyst computed the average initial order size in dollars
and the average repeat order size for years through This information is summarized in
Exhibit Hint: All exhibits were produced in SPSS hence the formats are comparable to
others weve seen in this class.
Armed with this information, Joan wants to know the average lifetime value of a customer for
each group. That is what is the average lifetime value of a customer whose initial purchase is
less than $ And what is the average lifetime value of a customer whose initial purchase is
$ or greater? In making these calculations, Joan has instructed you to assume the COGS is
about of the revenue and to use a discount factor of interest x a risk factor of
Joan has turned this information over to you and scheduled a meeting to review your analysis
and conclusions. In preparation for this meeting you should determine the average lifetime value
of a customer for each of the two groups. In addition, Joan mentioned several other points that
she would like your thoughts on:
What is the LTV over five years for customers who initially spend less than $
What is the LTV over five years for customers who initially spend $ or more?
Based on your findings, which group of customers has higher LTV
Since when has the higher LTV group of customers become profitable?
Should you keep sending catalogs to the lower LTV group of customers? Why or why not?
Hand in your CLV chart for each group.
Step by Step Solution
There are 3 Steps involved in it
1 Expert Approved Answer
Step: 1 Unlock

Question Has Been Solved by an Expert!
Get step-by-step solutions from verified subject matter experts
Step: 2 Unlock
Step: 3 Unlock