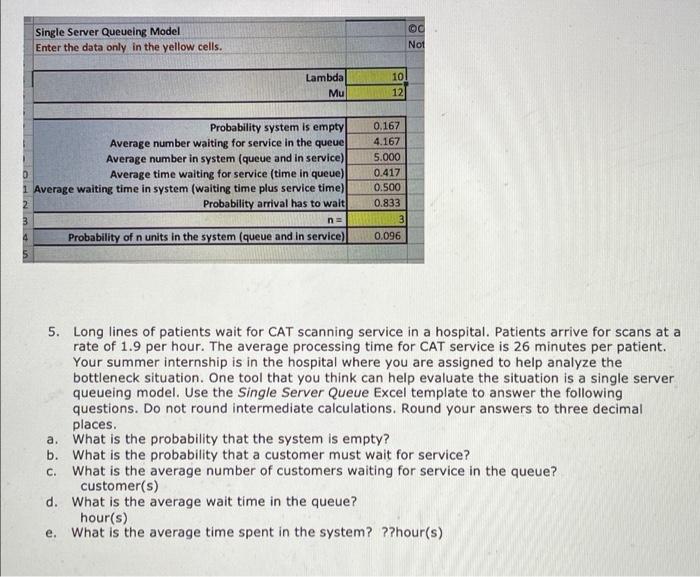
Question: Single Server Queueing Model Enter the data only in the yellow cells. Lambda Mu Probability system is empty 0.167 4.167 5.000 Average number waiting for

Single Server Queueing Model Enter the data only
Single Server Queueing Model Enter the data only in the yellow cells. Lambda Mu Probability system is empty 0.167 4.167 5.000 Average number waiting for service in the queue Average number in system (queue and in service) Average time waiting for service (time in queue) 1 Average waiting time in system (waiting time plus service time) Probability arrival has to wait 0.417 0.500 0.833 n= Probability of n units in the system (queue and in service) 0.096 5. Long lines of patients wait for CAT scanning service in a hospital. Patients arrive for scans at a rate of 1.9 per hour. The average processing time for CAT service is 26 minutes per patient. Your summer internship is in the hospital where you are assigned to help analyze the bottleneck situation. One tool that you think can help evaluate the situation is a single server queueing model. Use the Single Server Queue Excel template to answer the following questions. Do not round intermediate calculations. Round your answers to three decimal places. a. What is the probability that the system is empty? b. What is the probability that a customer must wait for service? C. What is the average number of customers waiting for service in the queue? customer(s) d. What is the average wait time in the queue? hour(s) e. What is the average time spent in the system? ??hour(s) OHN min. 2 3 10 12 O Not 3

Step by Step Solution

There are 3 Steps involved in it

1 Expert Approved Answer
Step: 1 Unlock blur-text-image
Question Has Been Solved by an Expert!

Get step-by-step solutions from verified subject matter experts

Step: 2 Unlock
Step: 3 Unlock

Students Have Also Explored These Related General Management Questions!