

Question: (SIX SIGMA) A project is looking at the time it takes field teams to repair faults in air conditioning systems on customer sites. Five consecutive
(SIX SIGMA)
A project is looking at the time it takes field teams to repair faults in air conditioning systems on customer sites. Five consecutive repair tasks were sampled every day for 20 days, and the measured times in hour are shown in the following table. task 1 task 2 task 3 task 4 task 5 3 4.9 4.5 6.8 4.8 4.4 4.1 4.2 5 5.2 5.1 3.8 3.6 4.5 5 5.6 6.5 4.9 6.2 6.9 4.7 4.2 5.3 3.2 6.7 5.7 6.3 5.1 3.7 5.1 4.9 4.1 4.2 4 6.7 4 6.1 4.6 6.1 3.2 6.4 3.2 3.5 5.6 5.4 5.8 3.8 3.1 3.8 6.2 3.8 6.6 5 3.2 4.2 3.4 4.7 6.1 6.1 5.6 5.2 3.2 6.3 6.7 3.4 4.8 6.6 4.3 3.2 6.1 4.5 6.2 5.9 4.8 4.5 4.6 4.2 6.9 6.6 6.2 3.8 3.7 5.8 5.4 3.2 5.3 3.5 6.8 6.8 6.4 5.1 3.2 4.8 4.6 5.2 5.7 5.9 6.9 3.8 5.3 Assume that 6 hours is the maximum allowable time by the customer. To avoid over-resourcing the repair teams are organized so that it takes at least 3 hours to finish a repair task. Use the given data to: 1) Verify whether or not the process is under control? (use the X-bar and R-bar charts) 2) Estimate the potential and actual process capabilities as well as process Sigma level (given a 1.5 shift from the target).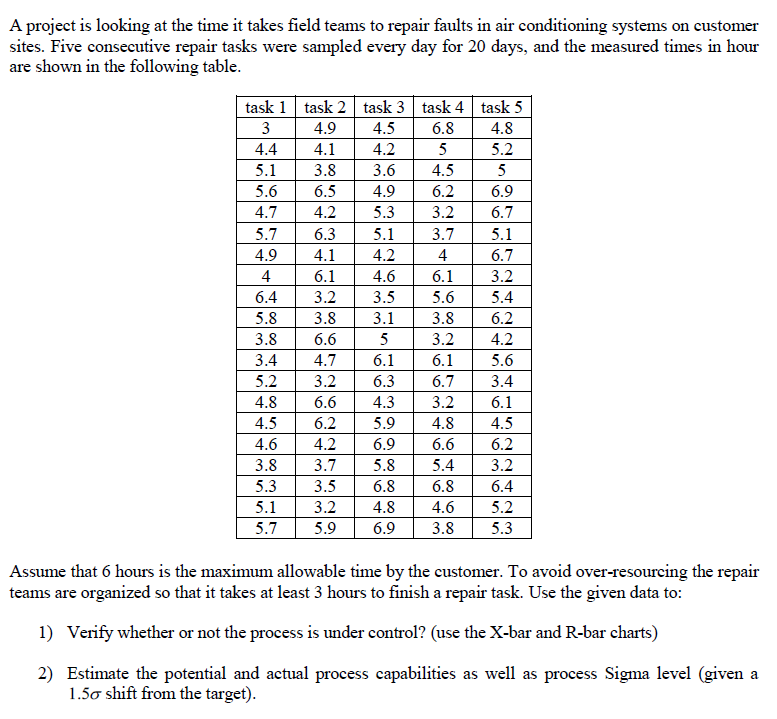
Step by Step Solution
There are 3 Steps involved in it

Get step-by-step solutions from verified subject matter experts