

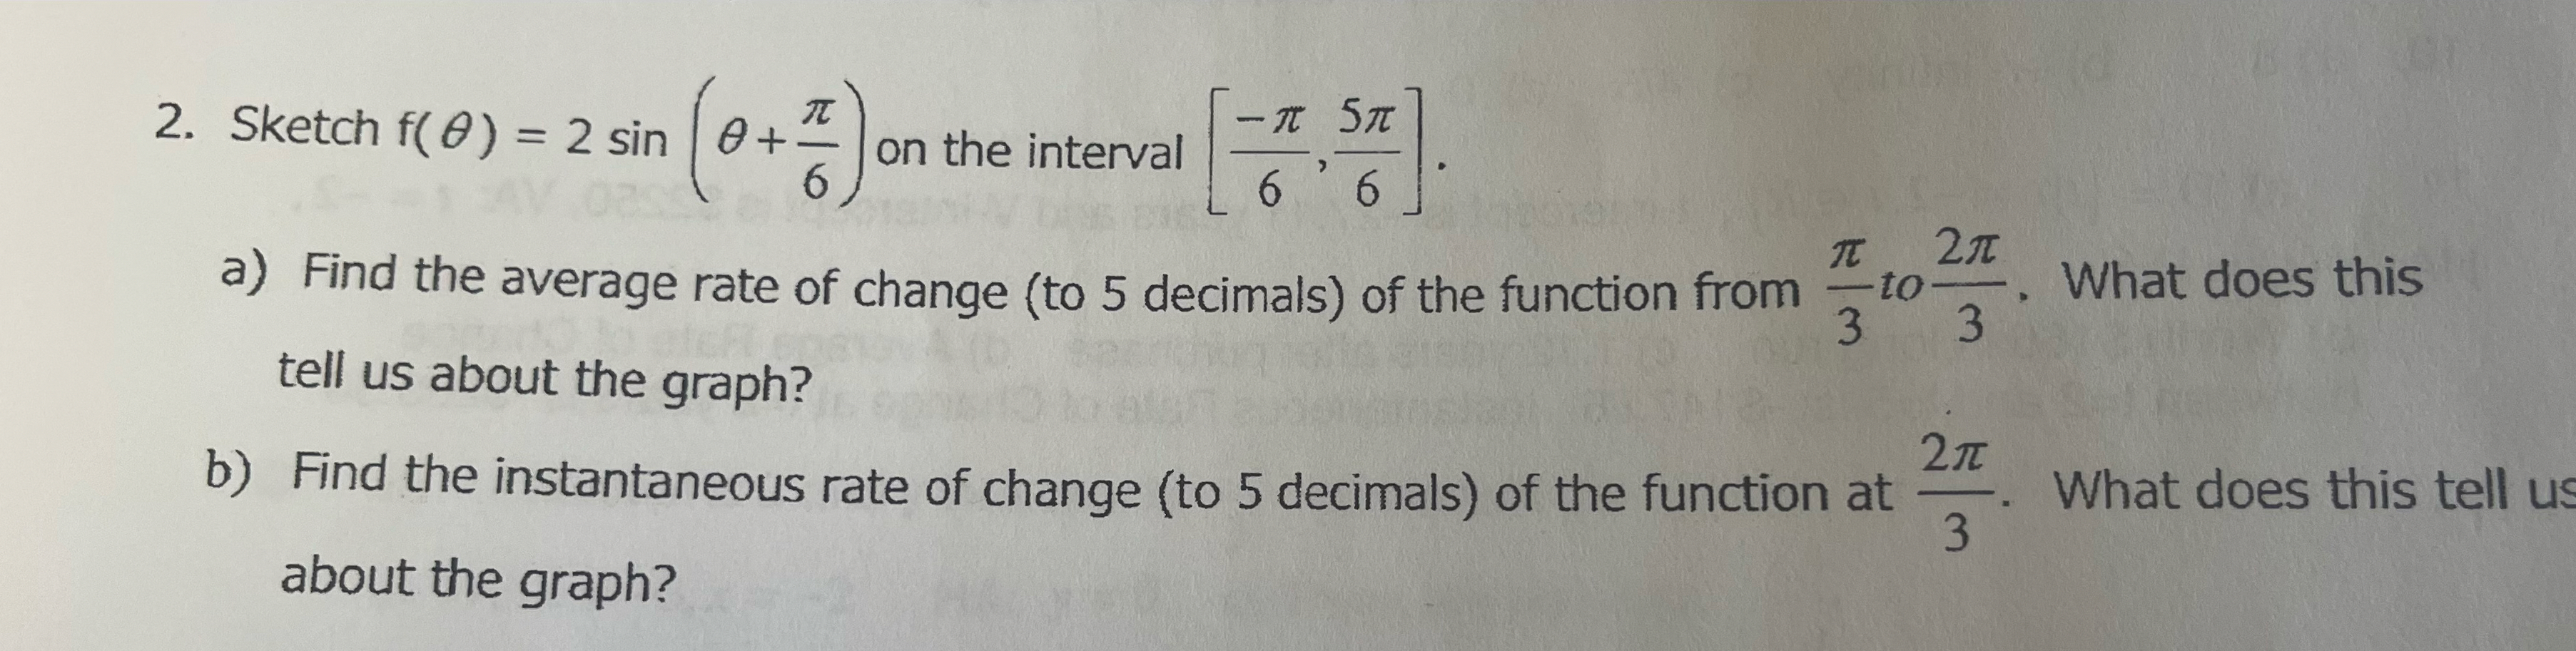
Question: Sketch f ( ) = 2 s i n ( + 6 ) on the interval - 6 , 5 6 . a ) Find
Sketch on the interval
a Find the average rate of change to decimals of the function from to What does this tell us about the graph?
b Find the instantaneous rate of change to decimals of the function at What does this tell us about the graph?
Step by Step Solution
There are 3 Steps involved in it
1 Expert Approved Answer
Step: 1 Unlock

Question Has Been Solved by an Expert!
Get step-by-step solutions from verified subject matter experts
Step: 2 Unlock
Step: 3 Unlock