

Question: Sketch the function represented by the given parametric equations. Then use the graph to defermine the following. a . Determine the intervals, if any, on
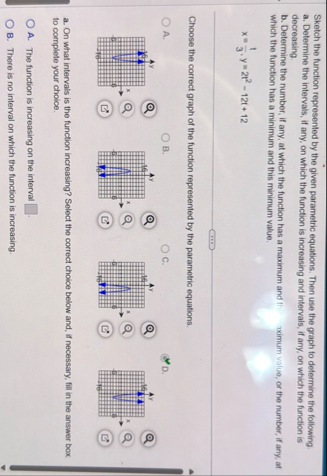
Sketch the function represented by the given parametric equations. Then use the graph to defermine the following.
a Determine the intervals, if any, on which the function is increasing and intervals, if any, on which the function is decreasing.
b Determine the number, if any, at which the function has a maximum and II uximum value, or the number, If any, at which the function has a minimum and this minimum value.
Choose the correct graph of the function represented by the parametric equations.
A B c D
a On what intervals is the function increasing? Select the correct choice below and, If necessary, fill in the answer box to complete your choice.
A The function is increasing on the interval
B There is no interval on which the function is increasing.
Step by Step Solution
There are 3 Steps involved in it
1 Expert Approved Answer
Step: 1 Unlock

Question Has Been Solved by an Expert!
Get step-by-step solutions from verified subject matter experts
Step: 2 Unlock
Step: 3 Unlock