

Question: Sllde 5 ( 1 0 marks ) As a data analyst, you must present findings from a recent marketing campalgn. You decide to create a
Sllde
marks
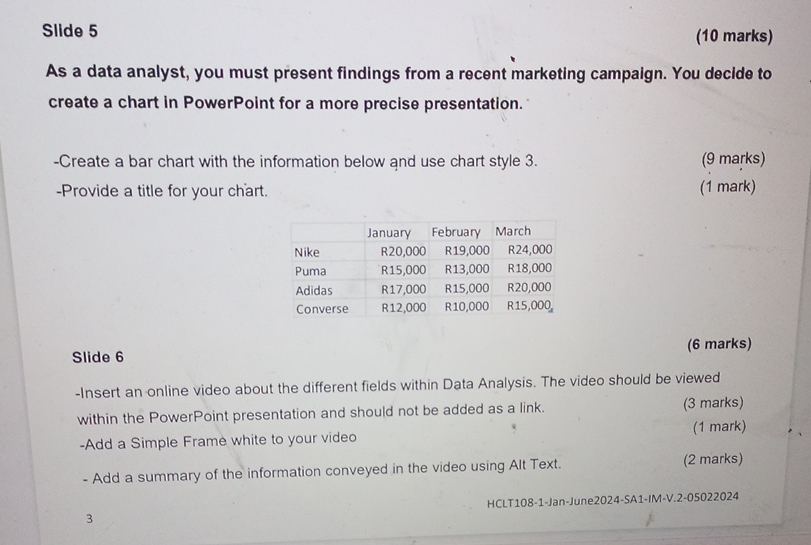
As a data analyst, you must present findings from a recent marketing campalgn. You decide to create a chart in PowerPoint for a more precise presentation.
Create a bar chart with the information below d use chart style
marks
Provide a title for your chart.
mark
tableJanuary,February,MarchNikeRRRPuma
Step by Step Solution
There are 3 Steps involved in it
1 Expert Approved Answer
Step: 1 Unlock

Question Has Been Solved by an Expert!
Get step-by-step solutions from verified subject matter experts
Step: 2 Unlock
Step: 3 Unlock