

Question: 1.Using the information provided in the data file MLS_data.xlsx, calculate the population per franchise for each existing and proposed MLS market. You should consider the
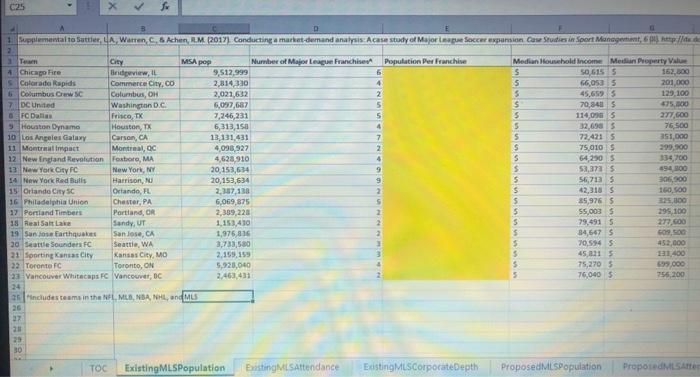
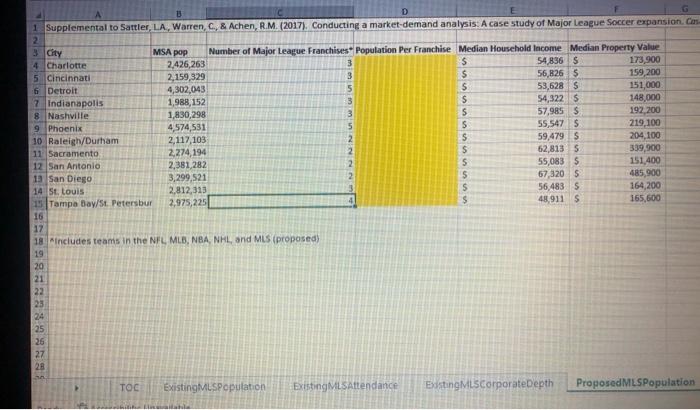
1.Using the information provided in the data file MLS_data.xlsx, calculate the population per franchise for each existing and proposed MLS market. You should consider the population data for each market, as well as the number of major-league franchises provided in the data set.
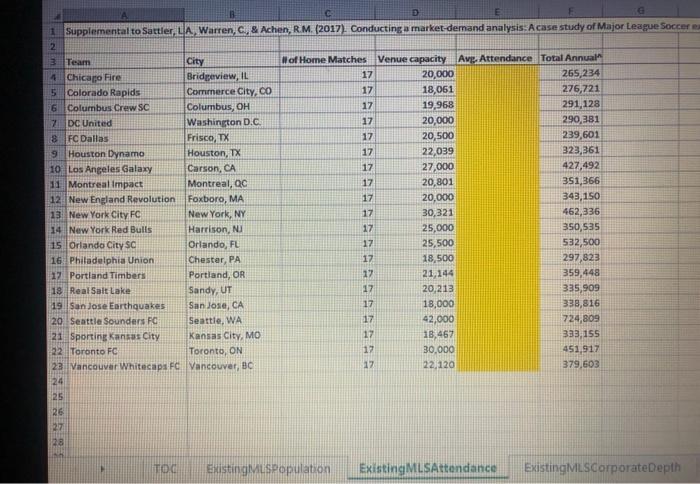
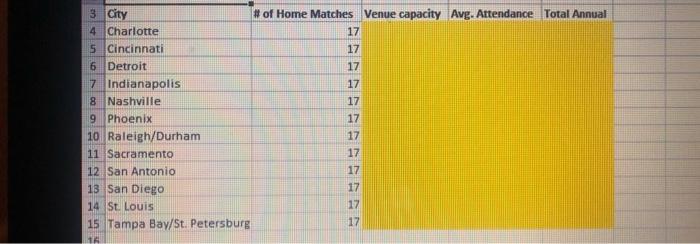
2. Using the information provided in the data file, calculate the average attendance for each existing MLS team. You should consider the number of home matches and total annual attendance.
3. You take a look at each proposed city and try to figure out how big the facility has to be. To get a ballpark number, you use three existing MLS cities as benchmarks. BUT these cities need to somewhat comparable in size and, especially, population per franchise. In other words, you wouldnt use NYC and LA to pinpoint proposed attendance numbers for Nashville. (For Q3, you take a look at each proposed city and try to figure out how big the facility has to be. To get a ballpark number, you use three existing MLS cities as benchmarks. BUT these cities need to somewhat comparable in size and, especially, population per franchise. In other words, you wouldnt use NYC and LA to pinpoint proposed attendance numbers for Nashville.)
4. Based on your analysis of your proposed market population (size, income, living costs), develop a tiered ticket pricing model that you believe will accommodate the local market. Consider your findings above, but also the data provided in the data set regarding average ticket pricing. (flows directly out of this, but here, for the only time, pick ONLY one of the proposed cities for your ticket-pricing model. Entirely your choice. This requires a bit of Googling beyond the information provided in the actual case. Once you have your comparable markets, youll be able to find that online pretty quickly - at least rough averages. You will want to have pricing that reflects your comparative markets but also your chosen proposed market. Higher prices for more affluent markets, lower prices for "poorer" markets - though nobody in their right mind would put a team where there's no money to be spent :) But you get the gist!)
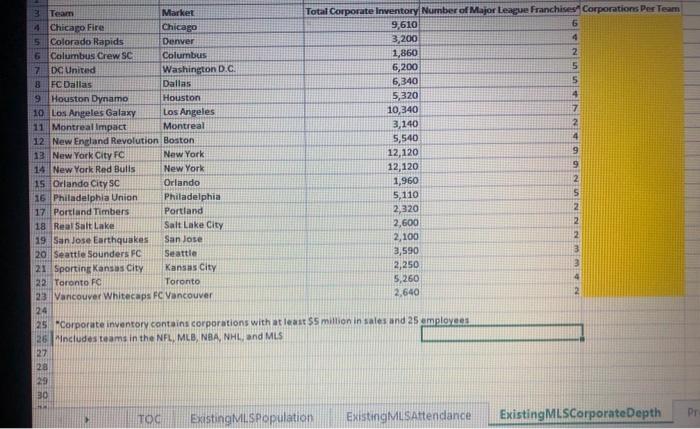
5. Complete a corporate depth analysis for the existing and proposed markets using the data set provided. Specifically, calculate the number of corporations per team across each market. How does the corporate depth for your proposed market compare with both those of the existing and proposed markets in the MLS? (Discuss how the new cities compare to the existing ones. You obviously already have the spreadsheet, but highlight notable cities that compare well - or not.)
6. Using the market approach to valuation, calculate the value of a potential naming-rights deal based on comparable MLS deals. Be sure to consider the data provided in Table 2 when conducting your analysis. (Ignore market approach to valuation and just propose a naming rights deal for each city, based on those for comparable markets (these will be the same existing cities you used for Q3).)
7. Based on the average future attendance that you calculated above, make a recommendation for the size of facility needed to accommodate this new MLS team. One way to estimate facility size is to conduct a comparables analysis using existing MLS markets for comparison. You should consider capacity at both a 100% sell-out rate and a 90% sell-out rate when making your determination. (Again, use existing similar cities to ballpark size of each new venue.)
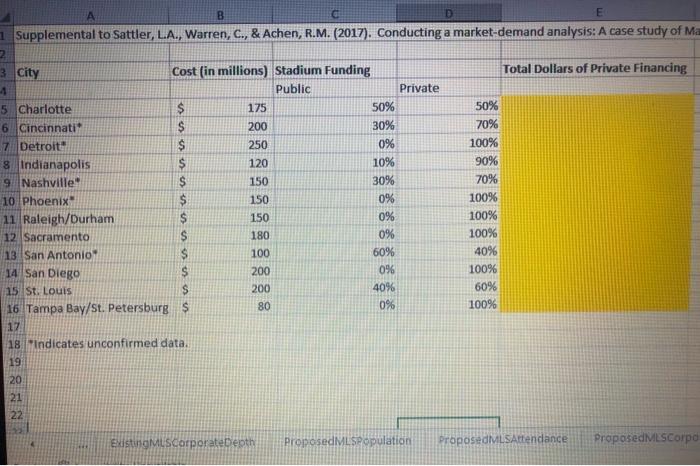
8. Using the data set provided in regard to proposed facility financing, calculate the total dollars of private financing put forth by each proposed market. How does the total dollars for your proposed market compare with those of both existing and proposed markets in the MLS? Be sure to use the data provided in Table 1 for reference. (Most of this will simply be filling out the spreadsheet. Highlight things that stand out.)
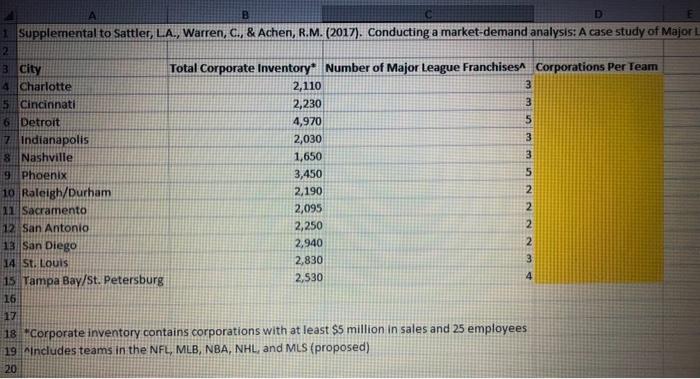
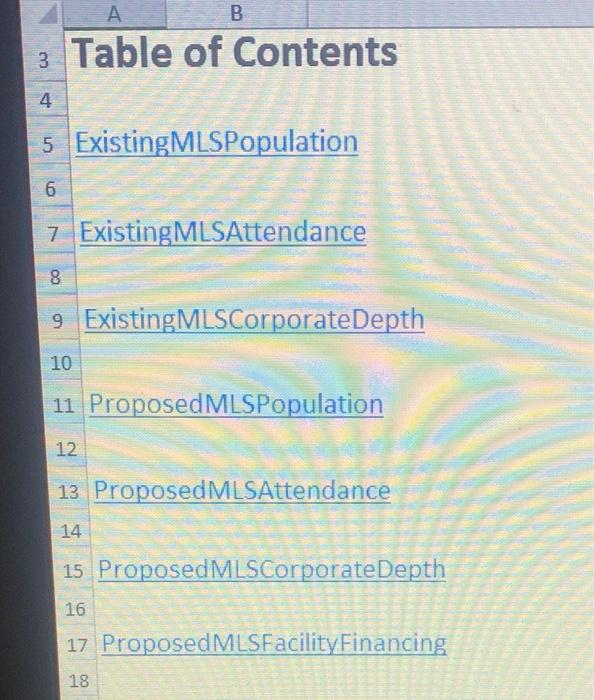
2 I Supplemental to Sattier, LA, Warren, C, \& Achen, R M. (2017). Conducting a market-demand analysis: A case study of Major League Soccer e e "Corporate inventory contains corporations with at least $5 millon in sales and 25 amnlovees Mncludes teams in the NFL. MEE, NeA. NHL., and MLS "Includes teams in the NFL. MLE. NBA. NHL, and MLS (proposed) * Corporate inventory contains corporations with at least $5 million in sales and 25 employees includes teams in the NFL, MLB, NBA, NHL, and MLS (proposed) A B c 1 Supplemental to Sattler, L.A., Warren, C., \& Achen, R.M. (2017). Conducting a market-demand analysis: A case study of M 18 * Indicates unconfirmed data. 19. 20 21 22 ExstingMiscorporatebenth prososedMLSpopulation proposedmLAtrendance ProposedMILCorpo Table of Contents ExistingMLSPopulation 6 7 ExistingMLSAttendance 8 9 ExistingMLSCorporateDepth 10 11 ProposedMLSPopulation 12 13 ProposedMLSAttendance 14 15 ProposedMLSCorporateDepth 16 17 ProposedMLSFacilityFinancing 18
Step by Step Solution
There are 3 Steps involved in it

Get step-by-step solutions from verified subject matter experts