Question: '' Software upgrade times (in minutes) are being evaluated. Samples of five observations each have been taken, and the results are as listed Software upgrade

'' Software upgrade times (in minutes) are being

'''' Software upgrade times (in minutes) are beingSoftware upgrade times (in minutes) are being evaluated. Samples of five observations each have been taken, and the results are as listed

Software upgrade times in minutes) are being evaluated. Samples of five observations each have been taken, and the results are as listed. 1 79.2 78.8 80.0 78.4 81.0 2. 80.5 78.7 81.0 80.4 80.1 SAMPLE 3 4 79.6 78.9 79.6 79.4 80.4 79.7 80.3 79.4 80.8 80.6 5 80.5 79.6 80.4 80.8 78.8 6 79.7 80.6 80.5 80.0 81.1 Click here for the Excel Data File Factors for three-sigma control limits for and R charts Factor for Chart, A2 Number of Observations in Subgroup, n 2 3 4 5 6 7 8 9 10 11 12 13 14 15 16 17 18 19 20 1.88 1.02 0.73 0.58 0.48 0.42 0.37 0.34 0.31 0.29 0.27 0.25 0.24 0.22 0.21 0.20 0.19 0.19 0.18 FACTORS FOR R CHARTS Lower Upper Control Control Limit, Limit, D3 04 3.27 0 2.57 2.28 0 2.11 2.00 0.08 1.92 0.14 1.86 0.18 1.82 0.22 1.78 0.26 1.74 0.28 1.72 0.31 1.69 0.33 1.67 0.35 1.65 0.36 1.64 0.38 1.62 0.39 1.61 0.40 1.60 0.41 1.59 a. Using factors from above table, determine upper and lower control limits for mean and range charts. (Round your intermediate calculations and final answers to 2 decimal places. Leave no cells blank - be certain to enter "O" wherever required.) Mean Chart Range Chart UCL LCL b. Decide if the process is in control. The process is in control. O The process is not in control

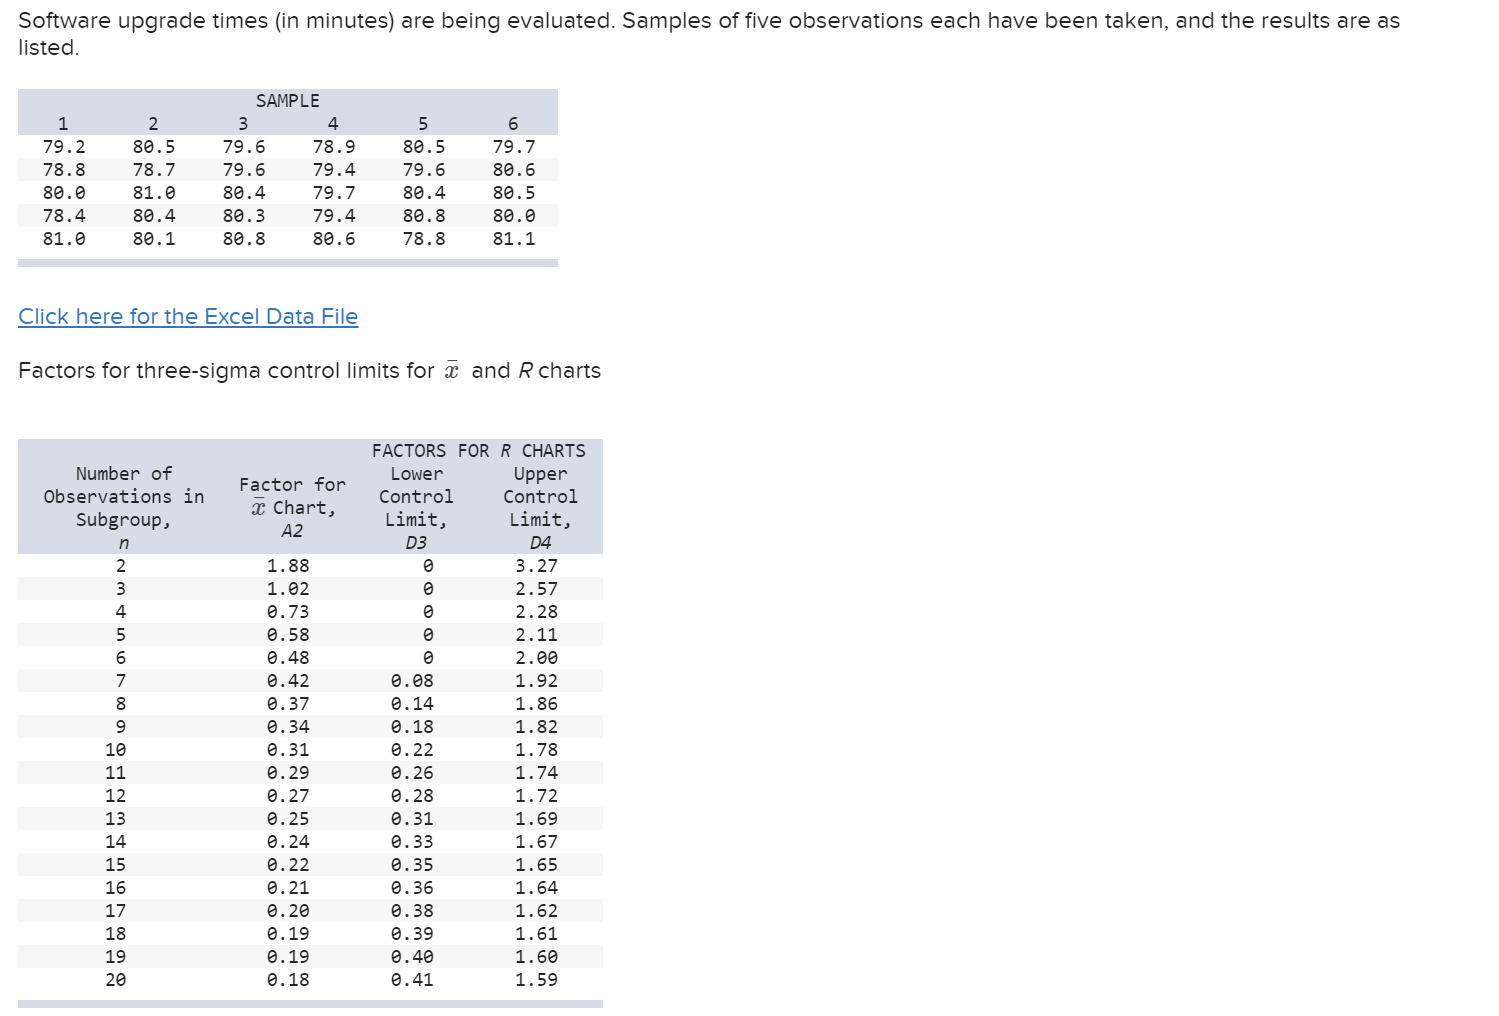
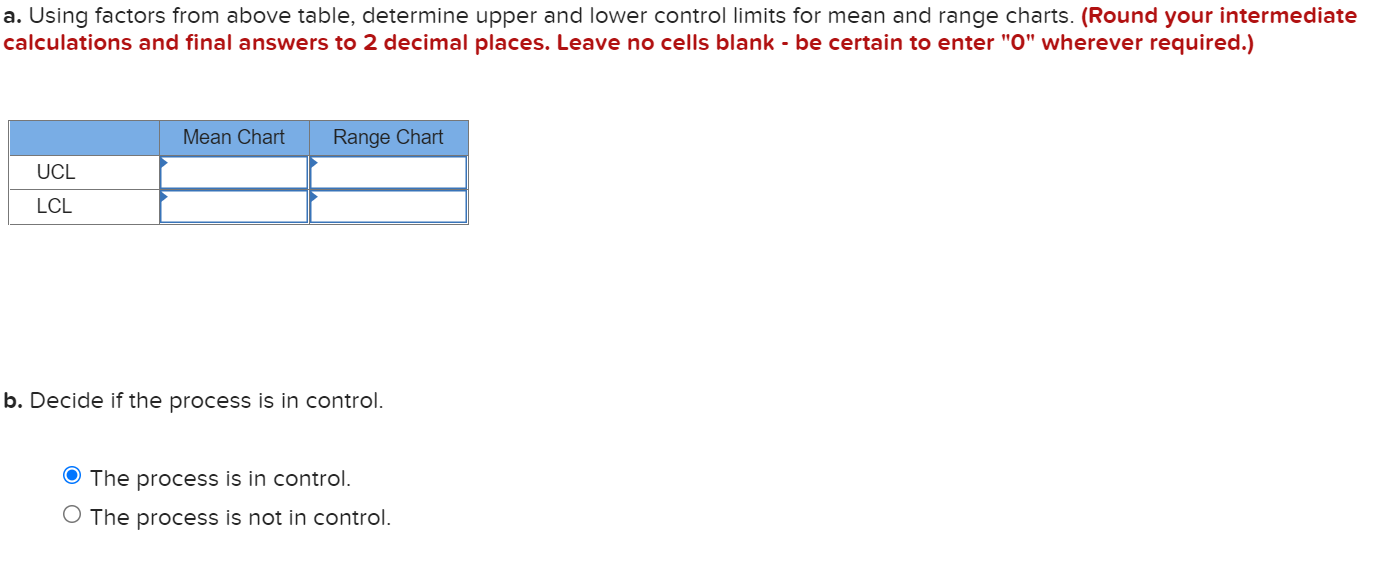
Step by Step Solution

There are 3 Steps involved in it

1 Expert Approved Answer
Step: 1 Unlock blur-text-image
Question Has Been Solved by an Expert!

Get step-by-step solutions from verified subject matter experts

Step: 2 Unlock
Step: 3 Unlock

Students Have Also Explored These Related General Management Questions!