

Question: Solve 6.2 section a and problem 6.5 (b) If specifications on this diameter are 0.5030 0.0010, find the percentage of nonconforming bearings produced by this
Solve 6.2 section a and problem 6.5 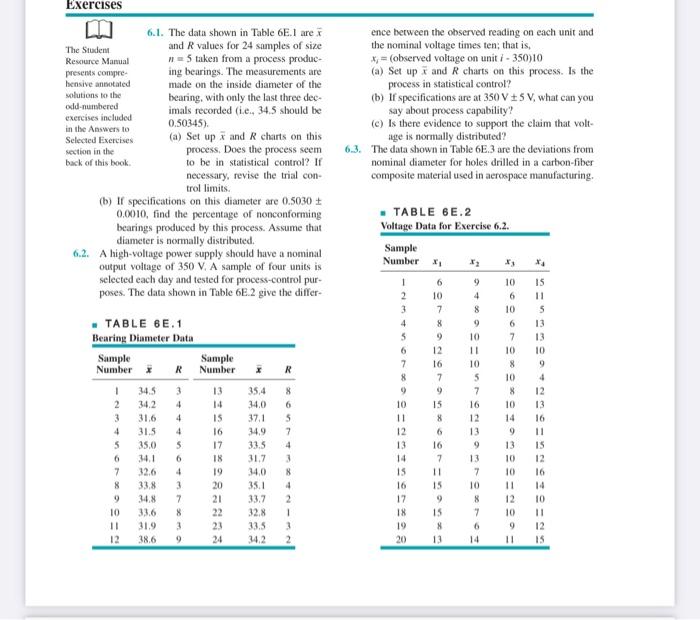
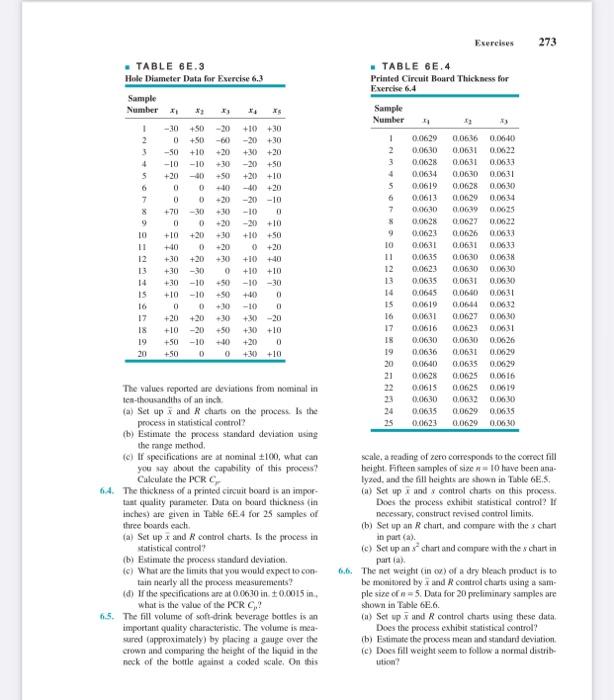
(b) If specifications on this diameter are 0.5030 0.0010, find the percentage of nonconforming bearings produced by this process. Assume that diameter is normally distributed. 6.2. A high-voltage power supply should have a nominal output voltage of 350V. A sample of four units is selected each day and tested for process-control purposes. The data shown in Table 6 E. 2 give the differ- - TABLE 6E,1 Bearine Diameter Data The valwes reported are deviations from noeninal in tea-thousandths of an inch. (a) Set up x and R charts on the process. Is the process in statistical coestrol? (b) Estamate the process standard devistion using the range method, (c) If specifications are at nomtint 100, what can seale, a reading of zero corresponds to the coerect fill you say about the capubitity of this proces? beight. Fifteen samples of size n a 10 lave beet ura Calculate the PCR Cr. lyzed, and the fill heights are shown in Tuble 6E.5, 6.4. The thickness of a printed circuit board is an importaat quality parameter. Dita on board thickness (in inches) are given in Table 6E4 for 25 samples of (a) Set up x and x control charts on this process. Does the process exhibit satistical control? If there hosards each. (a) Set up x and R control charts. Is the process in necessary, construct revised control limits, Set up an R chart, and compane with the s chart (b) Set up an r in part (a). statistical control? (c) Set up an x2 chart and compare with the s chart in (b) Estimate the peocess standard deviation. part (a). (c) What are the limuts that you would expect to con- ain nearly all the process measuremens? (d) If the specifications are at 0.0630 in 0.0015 in 6.6. The net weight (in ou) of a dry bleach prodact is to ple sive of n=5. Data 6.5. The fill volame of soft-drink beverage bottles is an (a) Set ep x and R control charts using these data. important quality characteristic. The volume is meaDoes the poocess exhibit statistical control? suncd (appeximately) by placing a gauge over the (b) Estimate the process mean and standard deriation crown and comparing the height of the liquid in the (c) Does fill weight secen to follow a nermal distribnock of the boutle against a colked weale, On this Step by Step Solution
There are 3 Steps involved in it
1 Expert Approved Answer
Step: 1 Unlock

Question Has Been Solved by an Expert!
Get step-by-step solutions from verified subject matter experts
Step: 2 Unlock
Step: 3 Unlock