

Question: Solve clearly 1. Using the following graph to answer following question by filling in the blank spaced. Suppose income level is constant at / =
Solve clearly
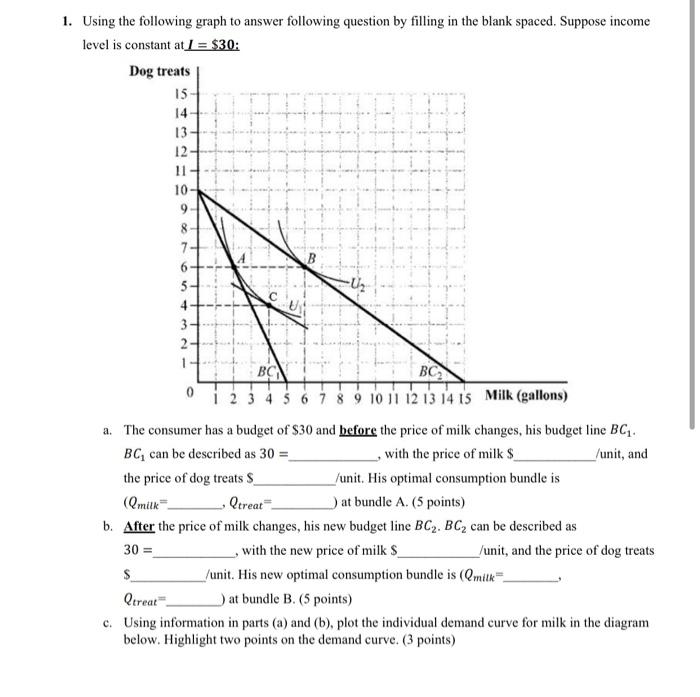
1. Using the following graph to answer following question by filling in the blank spaced. Suppose income level is constant at / = $30: Dog treats | 15 14 13 12- 9 10 11 12 13 14 15 Milk (gallons) a. The consumer has a budget of $30 and before the price of milk changes, his budget line BC,. BC, can be described as 30 =_ , with the price of milk $ /unit, and the price of dog treats $_ /unit. His optimal consumption bundle is (@milk Qtreat _) at bundle A. (5 points) b. After the price of milk changes, his new budget line BC2. BC2 can be described as 30 = with the new price of milk $_ /unit, and the price of dog treats S /unit. His new optimal consumption bundle is (Qmilk= Qtreat ) at bundle B. (5 points) c. Using information in parts (a) and (b), plot the individual demand curve for milk in the diagram below. Highlight two points on the demand curve. (3 points)
Step by Step Solution
There are 3 Steps involved in it

Get step-by-step solutions from verified subject matter experts