

Question: Solve clearly. Use the graph input tool to help you answer the following questions. You will not be graded on any changes you make to
Solve clearly.
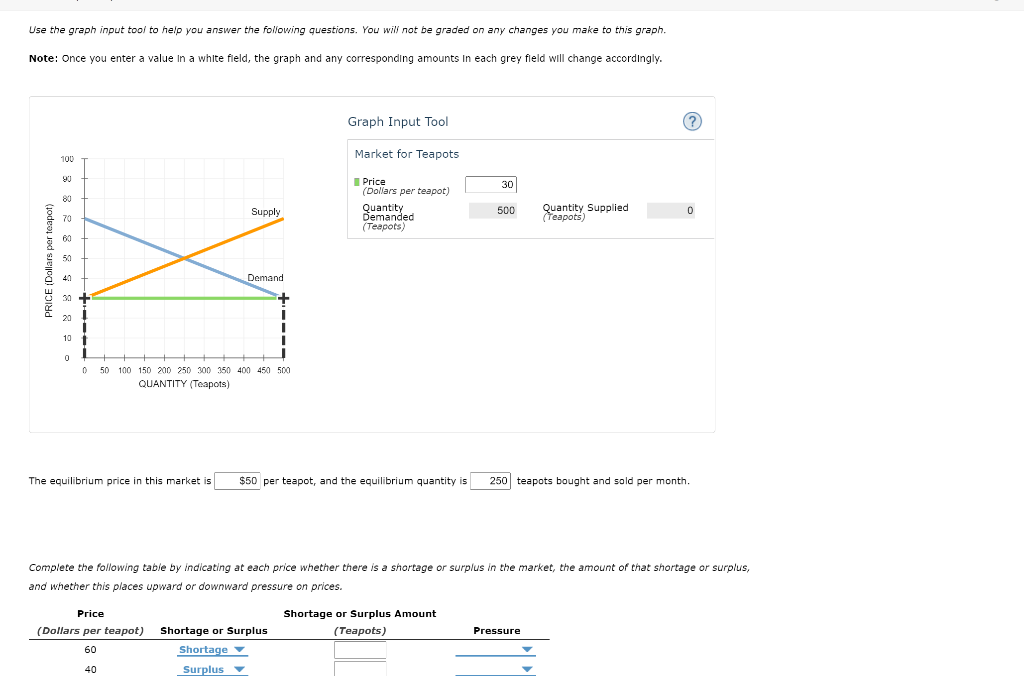
Use the graph input tool to help you answer the following questions. You will not be graded on any changes you make to this graph. Note: Once you enter a value in a white field, the graph and any corresponding amounts in each grey field will change accordingly. Graph Input Tool (?) 10U Market for Teapots Price 30 (Dollars per teapot) Supply Quantity 500 Quantity Supplied Demanded (Teapots) (Teapots PRICE (Dollars per teapot) Demand 50 100 150 200 250 300 350 400 450 500 QUANTITY (Teapots) The equilibrium price in this market is $50 per teapot, and the equilibrium quantity is 250 teapots bought and sold per month. Complete the following table by indicating at each price whether there is a shortage or surplus in the market, the amount of that shortage or surplus, and whether this places upward or downward pressure on prices. Price Shortage or Surplus Amount (Dollars per teapot) Shortage or Surplus (Teapots Pressure 60 Shortage Surplus
Step by Step Solution
There are 3 Steps involved in it

Get step-by-step solutions from verified subject matter experts