

Question: solve for the blue squares in excell. ili Conditional Format Cal Formatting as Table Styles xfx P E G H J L M B D
solve for the blue squares in excell. 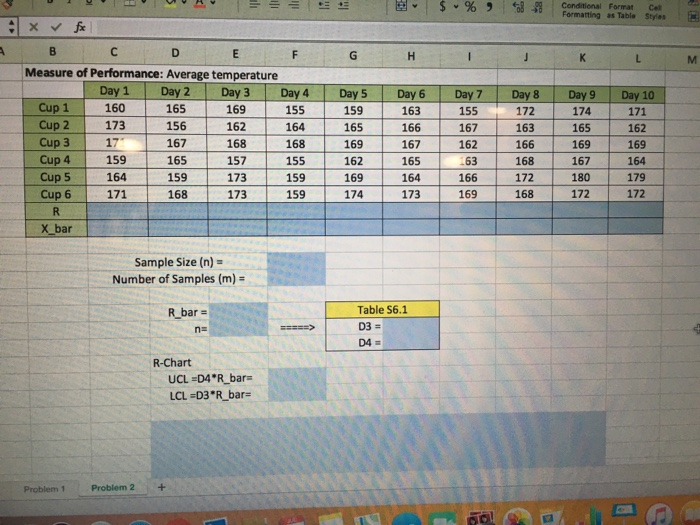
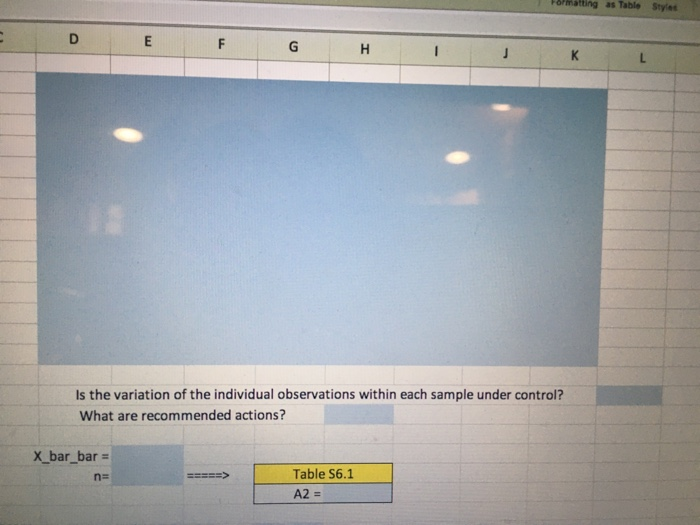
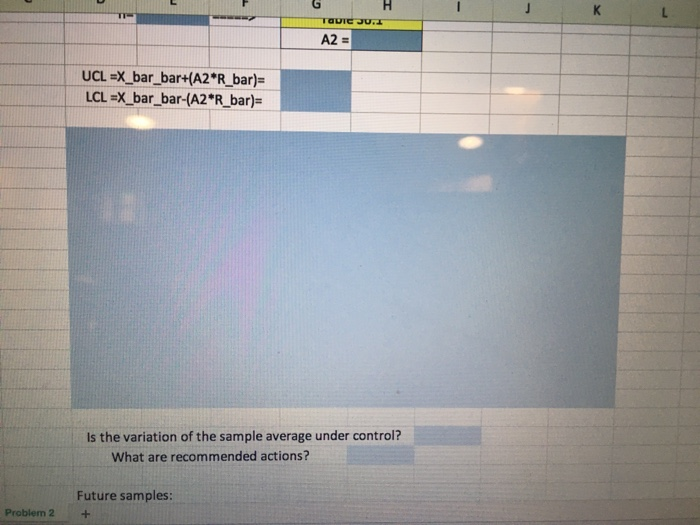
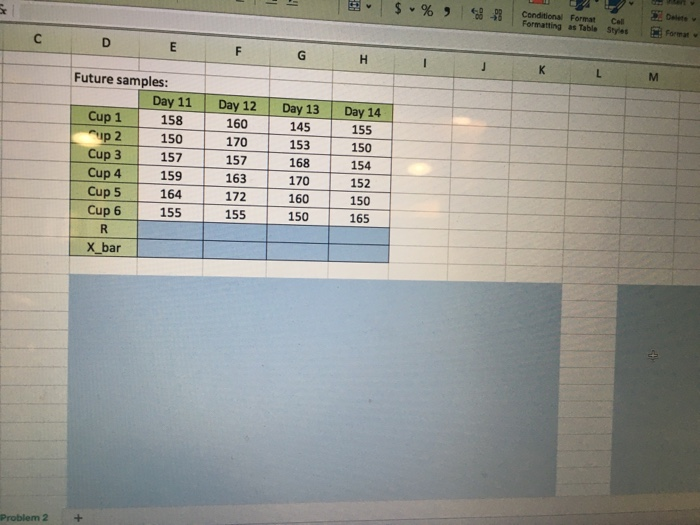
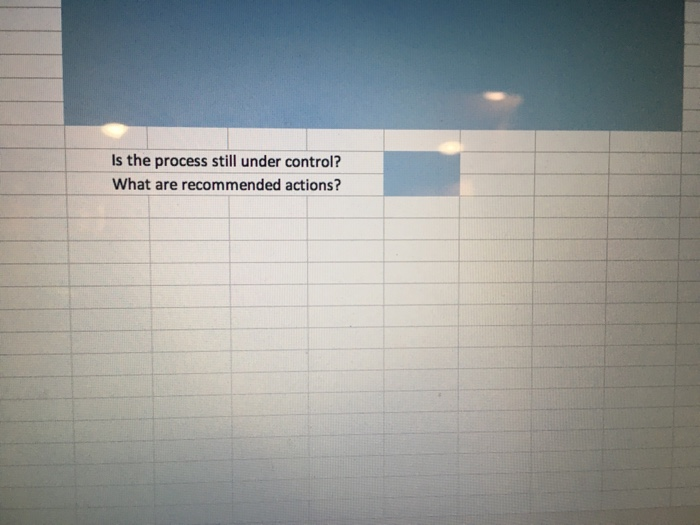
ili Conditional Format Cal Formatting as Table Styles xfx P E G H J L M B D F Measure of Performance: Average temperature Day 1 Day 2 Day 3 Day 4 Cup 1 160 165 169 155 Cup 2 173 156 162 164 Cup 3 17 167 168 168 Cup 4 159 165 157 155 Cup 5 164 159 173 159 Cup 6 171 168 173 159 R X_bar Day 5 159 165 169 162 169 174 Day 6 163 166 167 165 164 173 Day 7 155 167 162 163 166 169 Day 8 172 163 166 168 172 168 Day 9 174 165 169 167 180 172 Day 10 171 162 169 164 179 172 Sample Size (n) - Number of Samples (m) = R_bar = n= Table 56.1 D3 = D4 R-Chart UCL =D4 *R_bar- LCL =D3*R_bar- Problem 1 Problem 2 + atting as Table Styles D E F G H K L Is the variation of the individual observations within each sample under control? What are recommended actions? X_bar_bar n= Table 56.1 A2 = G K TT- TOUIC JUI A2 = UCL =X_bar_bar+(A2*R_bar)= LCL =X_bar_bar-(A2*R_bar)= Is the variation of the sample average under control? What are recommended actions? Future samples: Problem 2 + " $ %, 8-23 Conditional Format Call Formatting as Table Styles Da for D E F G H K M Day 12 160 170 Future samples: Day 11 Cup 1 158 up 2 150 Cup 3 157 Cup 4 159 Cup 5 164 Cup 6 155 R X_bar 157 Day 13 145 153 168 170 160 150 Day 14 155 150 154 152 150 165 163 172 155 Problem 2 Is the process still under control? What are recommended actions
Step by Step Solution
There are 3 Steps involved in it
1 Expert Approved Answer
Step: 1 Unlock

Question Has Been Solved by an Expert!
Get step-by-step solutions from verified subject matter experts
Step: 2 Unlock
Step: 3 Unlock