

Question: Solve in Excel and show formulas. Year A 16 Covariance 112212 17 Correlation 11 12 13 14 Average return 15 Standard deviation 18 2000 2001
Solve in Excel and show formulas.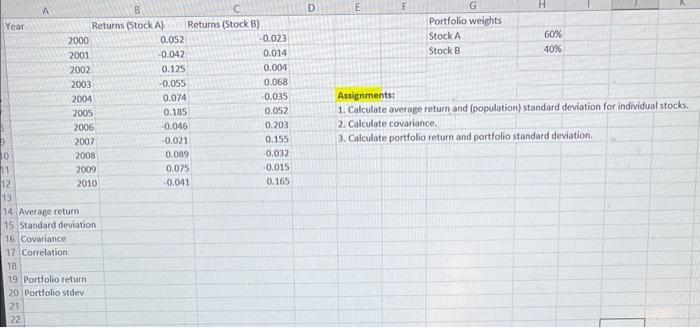
Year A 16 Covariance 112212 17 Correlation 11 12 13 14 Average return 15 Standard deviation 18 2000 2001 2002 2003 2004 2005 B Returns (Stock A) 2006 2007 2008 2009 2010 19 Portfolio return. 20 Portfolio stdev Returns (Stock B) 0.052 -0.042 0.125 -0.055 0.074 0.185 -0.046 -0.021 0.089 0.075 -0.041 -0.023 0.014 0.004 0.068 -0.035 0.052 0.203 0.155) -0.032 -0.015 0.165 D G Portfolio weights Stock A Stock B H 60% 40% Assignments: 1. Calculate average return and (population) standard deviation for individual stocks. 2. Calculate covariance. 3. Calculate portfolio return and portfolio standard deviation.
Step by Step Solution
3.43 Rating (162 Votes )
There are 3 Steps involved in it
To calculate the average return and standard deviation for individual stocks as well as the covariance and portfolio return and standard deviation we can use the given data 1 Calculate average return ... View full answer

Get step-by-step solutions from verified subject matter experts