

Question: solve on paper please The table below shows the prices for two stocks at the beginning of the year for six consecutive years. Use this
solve on paper please
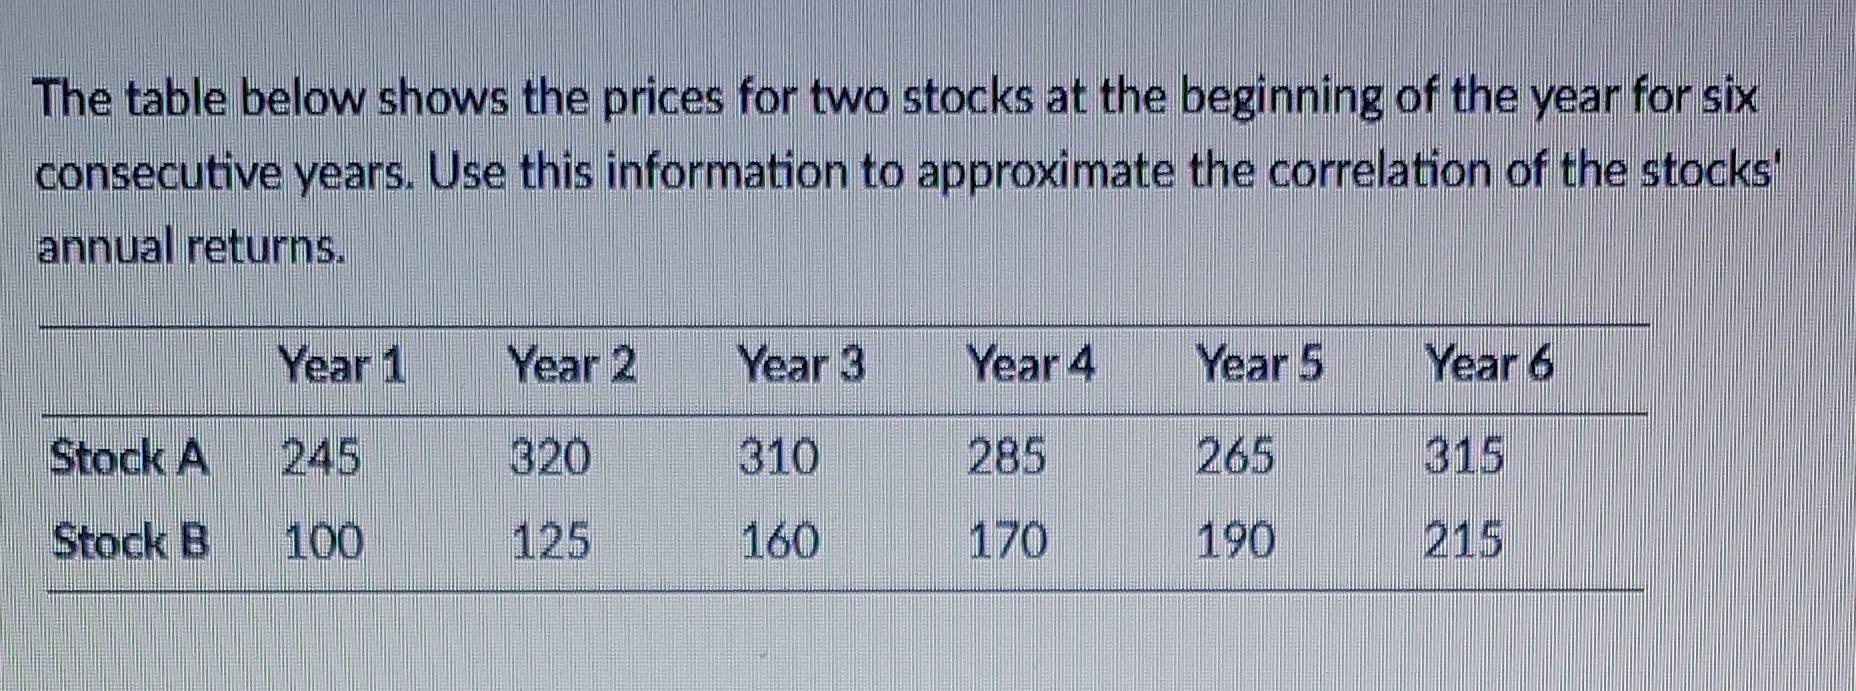
The table below shows the prices for two stocks at the beginning of the year for six consecutive years. Use this information to approximate the correlation of the stocks annual returns. Year 1 Year 3 Year 4 Year 5 Year 6 Stock A 245 320 310 285 Stock B 100 125 160 170 190 215
Step by Step Solution
There are 3 Steps involved in it
1 Expert Approved Answer
Step: 1 Unlock

Question Has Been Solved by an Expert!
Get step-by-step solutions from verified subject matter experts
Step: 2 Unlock
Step: 3 Unlock