

Question: The table below shows the prices for two stocks at the beginning of the year for six consecutive years. Use this information to approximate the
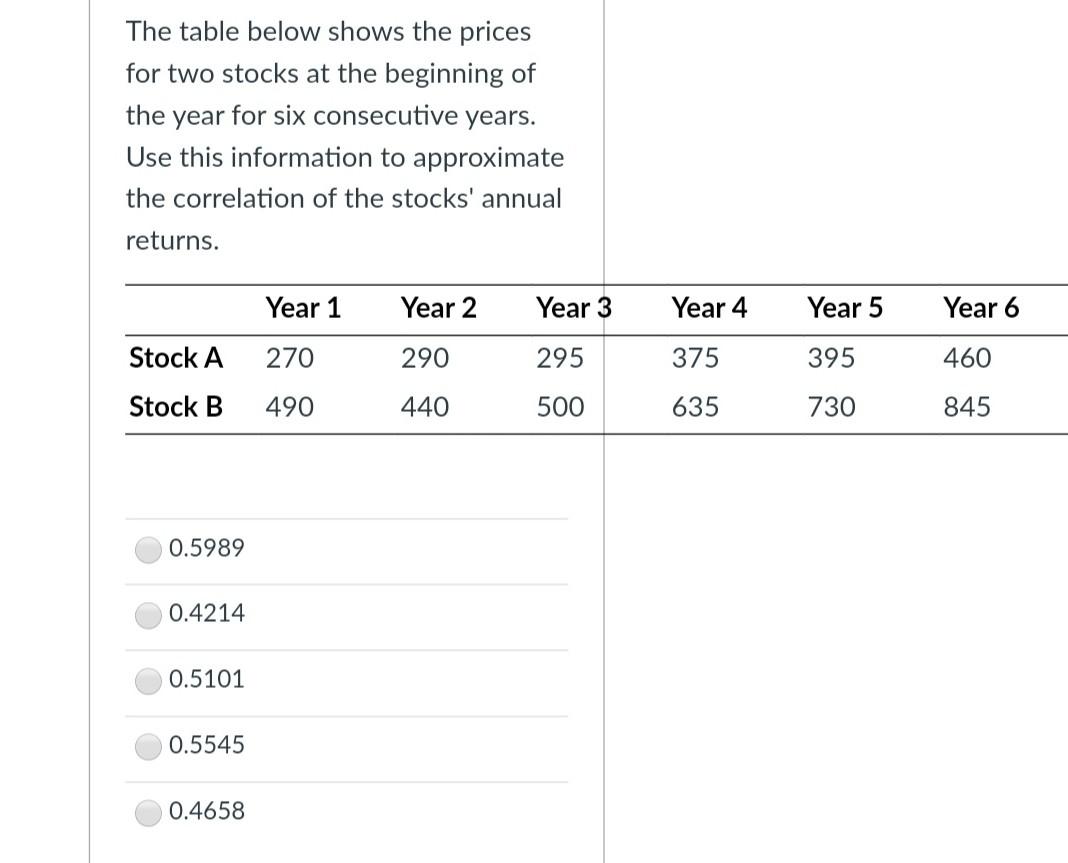
The table below shows the prices for two stocks at the beginning of the year for six consecutive years. Use this information to approximate the correlation of the stocks' annual returns. Year 1 Year 2 Year 3 Year 4 Year 5 Year 6 Stock A 270 290 295 375 395 460 Stock B 490 440 500 635 730 845 0.5989 0.4214 0.5101 0.5545 0.4658
Step by Step Solution
There are 3 Steps involved in it
1 Expert Approved Answer
Step: 1 Unlock

Question Has Been Solved by an Expert!
Get step-by-step solutions from verified subject matter experts
Step: 2 Unlock
Step: 3 Unlock