

Question: Solve the glue drying problem. Chapter 10 Glue Drying Problem - Answer Sheet X double bar R bar UCL bar Show calculation: LCL bar Show
Solve the glue drying problem. 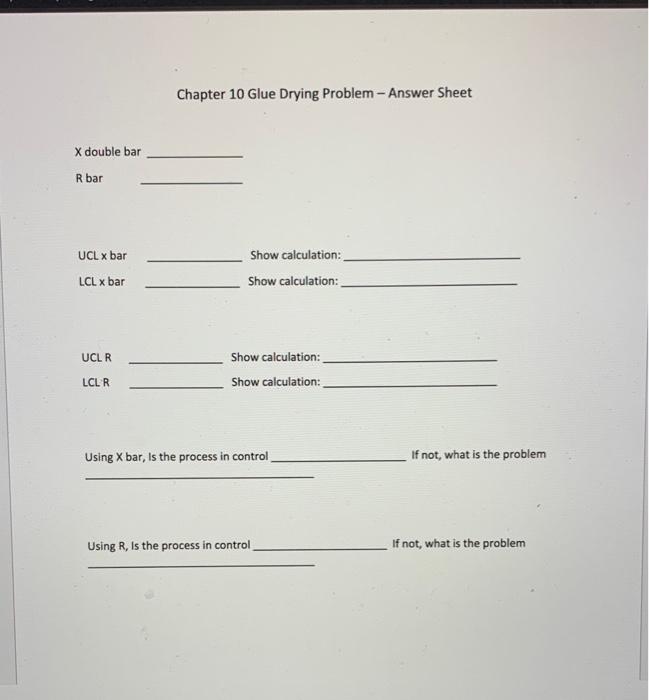
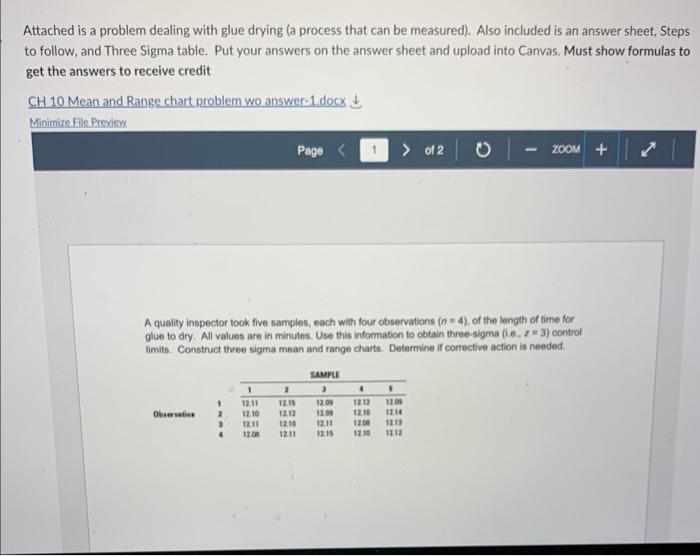

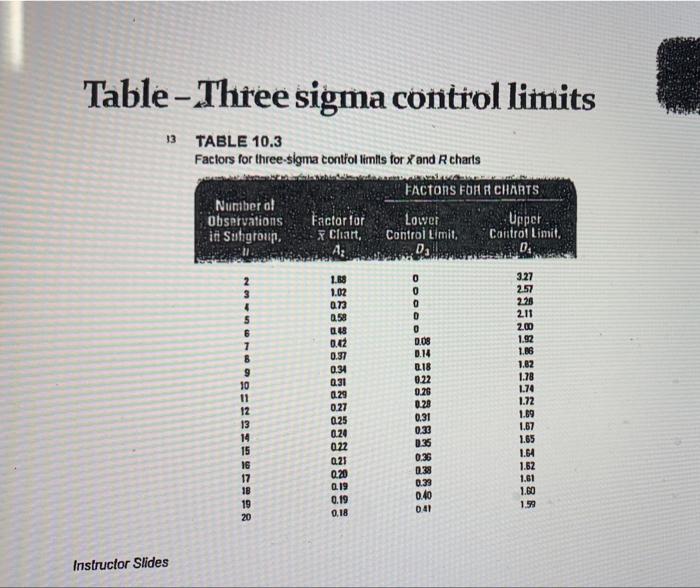
Chapter 10 Glue Drying Problem - Answer Sheet X double bar R bar UCL bar Show calculation: LCL bar Show calculation: UCL R Show calculation: LCLR Show calculation: Using X bar, Is the process in control If not, what is the problem Using R, Is the process in control If not, what is the problem Attached is a problem dealing with glue drying (a process that can be measured). Also included is an answer sheet, Steps to follow, and Three Sigma table. Put your answers on the answer sheet and upload into Canvas. Must show formulas to get the answers to receive credit CH 10 Mean and Range chart problem wo answer-1.docs Minimize file Preview Steps for X bar and R - Determine# of sample Periods/Times - Determine how many observations per Sample Period. This # will be used in Three sigma table - Determine the mean (average) of the observations per Sample Period =X bar - Average the means ( x bar) of each sample period = X (double bar) or grand mean. - Calculate the dispersion (high vs low) for each sample period = Range. - Average the Ranges (dispersions) to get R bar. - Go to Table and using # of observations get A2,D3, and D4. - Graph UCL and LCL and plot X bar means and R dispersions to see if in control insiructor Sides Table-Thiree sigma contiol limits 13 TABLE 10.3 Factors for three-sigma contfol limits for x and R charis Inslructor Slides Step by Step Solution
There are 3 Steps involved in it
1 Expert Approved Answer
Step: 1 Unlock

Question Has Been Solved by an Expert!
Get step-by-step solutions from verified subject matter experts
Step: 2 Unlock
Step: 3 Unlock