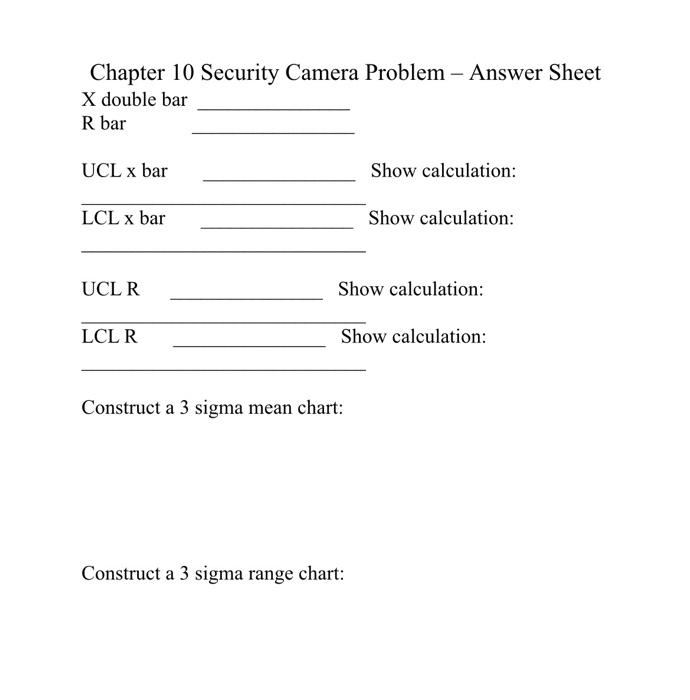
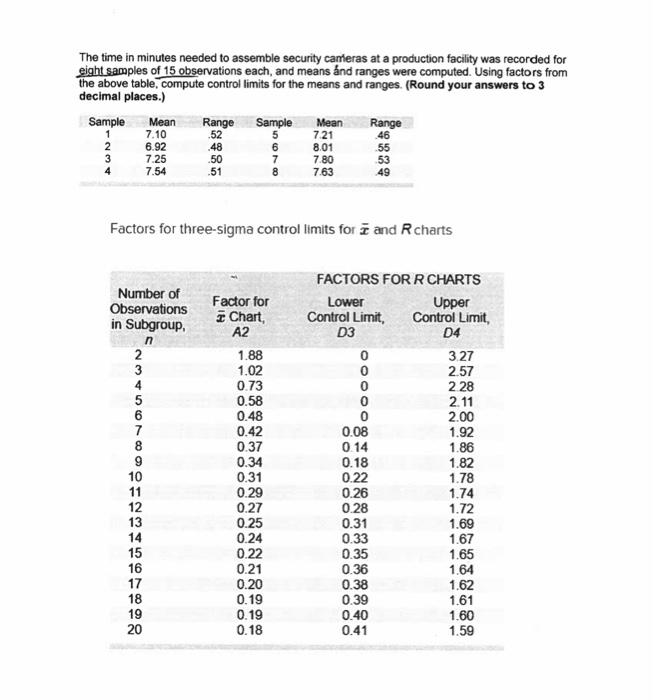
Question: Chapter 10 Security Camera Problem - Answer Sheet X double bar R bar UCL x bar Show calculation: LCL x bar Show calculation: UCLR Show

Chapter 10 Security Camera Problem - Answer Sheet
Chapter 10 Security Camera Problem - Answer Sheet X double bar R bar UCL x bar Show calculation: LCL x bar Show calculation: UCLR Show calculation: LCL R Show calculation: Construct a 3 sigma mean chart: Construct a 3 sigma range chart: The time in minutes needed to assemble security cameras at a production facility was recorded for eight samples of 15 observations each, and means and ranges were computed. Using factors from the above table, compute control limits for the means and ranges. (Round your answers to 3 decimal places.) Sample Range Sample Mean Range 721 6 55 7 53 .51 7.63 49 46 1 2 3 4 Mean 7.10 6.92 7.25 7.54 .52 48 .50 8.01 7.80 8 Factors for three-sigma control limits for 7 and Rcharts OOOOO Number of Observations in Subgroup. n 2 3 4 5 6 7 8 9 10 11 12 13 14 15 16 17 18 19 20 Factor for i Chart A2 1.88 1.02 0.73 0.58 0.48 0.42 0.37 0.34 0.31 0.29 0.27 0.25 0.24 0.22 0.21 0.20 0.19 0.19 0.18 FACTORS FOR R CHARTS Lower Upper Control Limit Control Limit D3 D4 327 2.57 2 28 2.11 2.00 0.08 1.92 0.14 1.86 0.18 1.82 0.22 1.78 0.26 1.74 0.28 1.72 0.31 1.69 0.33 1.67 0.35 1.65 0.36 1.64 0.38 1.62 1.61 0.40 1.60 0.41 1.59 0.39

Step by Step Solution

There are 3 Steps involved in it

1 Expert Approved Answer
Step: 1 Unlock blur-text-image
Question Has Been Solved by an Expert!

Get step-by-step solutions from verified subject matter experts

Step: 2 Unlock
Step: 3 Unlock

Students Have Also Explored These Related General Management Questions!