

Question: Solve the problem. 25 34 37 38 38 40 42 42 42 42 44 44 47 48 48 49 50 52 56 60 Prepare un
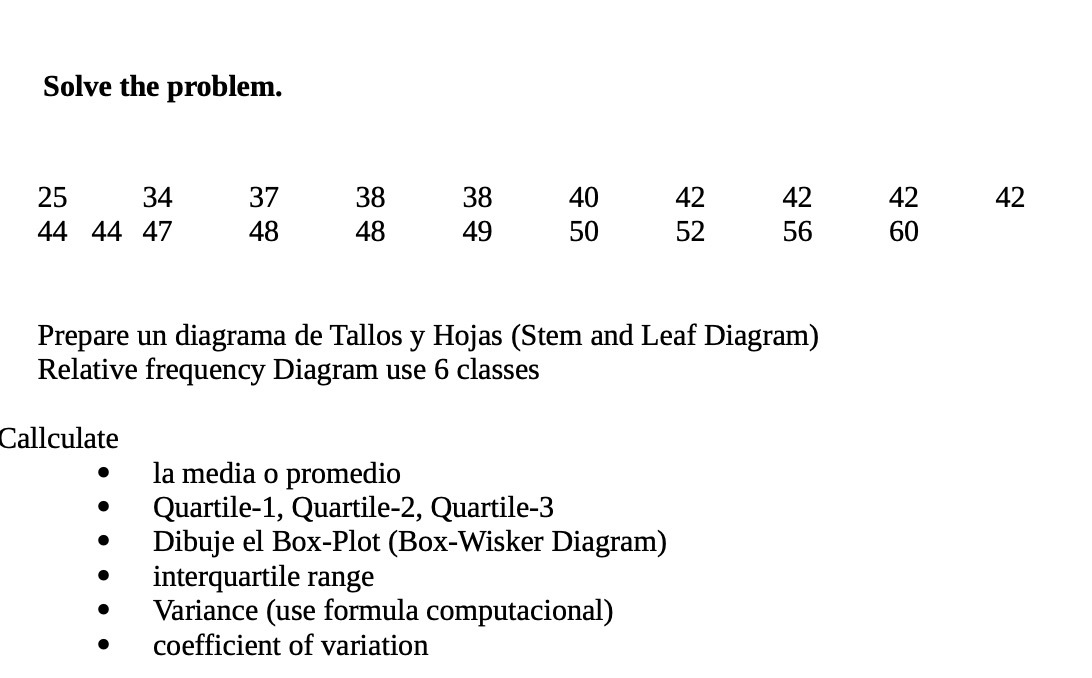

Solve the problem. 25 34 37 38 38 40 42 42 42 42 44 44 47 48 48 49 50 52 56 60 Prepare un diagrama de Tallos y Hojas (Stem and Leaf Diagram) Relative frequency Diagram use 6 classes Callculate la media o promedio Quartile-1, Quartile-2, Quartile-3 Dibuje el Box-Plot (Box-Wisker Diagram) interquartile range . Variance (use formula computacional) coefficient of variation
Step by Step Solution
There are 3 Steps involved in it
1 Expert Approved Answer
Step: 1 Unlock

Question Has Been Solved by an Expert!
Get step-by-step solutions from verified subject matter experts
Step: 2 Unlock
Step: 3 Unlock