

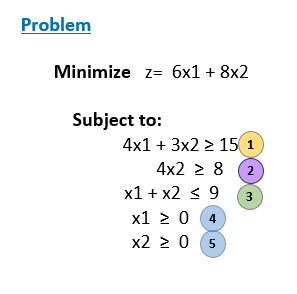
Question: Solve the problem Graphically, Considering: 1. Feasibility Region: (15pts) - Draw the lines that represent each constraint to find the feasible region. You should show
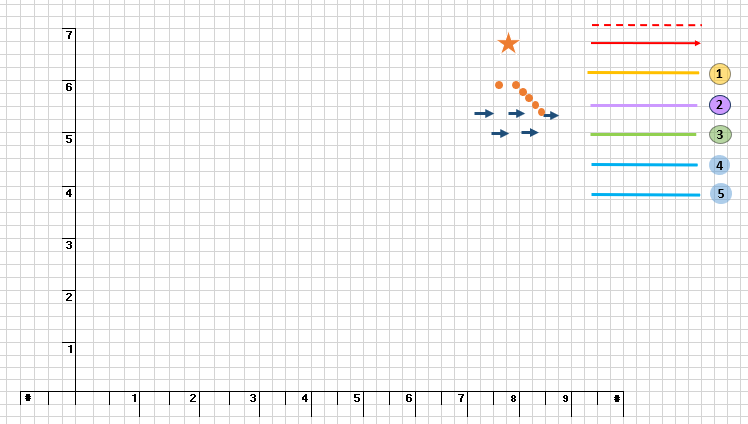
Solve the problem Graphically, Considering: 1. Feasibility Region: (15pts) - Draw the lines that represent each constraint to find the feasible region. You should show all the calculations to obtain full points. - Use a different color for each line and enumerate them. - If you find a feasible region, use a light color to differentiate it. 2. Gradient (3 pts) - Calculate the gradient of the objective function and draw it (using the given red arrow) 3. Level curves (3 pts) - Draw the objective function (using the given dashed red line) to do the search for the optimal solution. 4. Optimal solution (6 pts) - Indicate in the graph the optimal point using the given orange star. - Calculate the coordinates of the optimal point. You should show all the calculations to obtain full points. 5. Identify all feasible extreme points (also called corner points) (3 pts) - Identify feasible extreme points in the graph with the given orange dots NOTE: If you are working by hand, procure a neat handwriting and a quality pictures

Step by Step Solution
There are 3 Steps involved in it

Get step-by-step solutions from verified subject matter experts