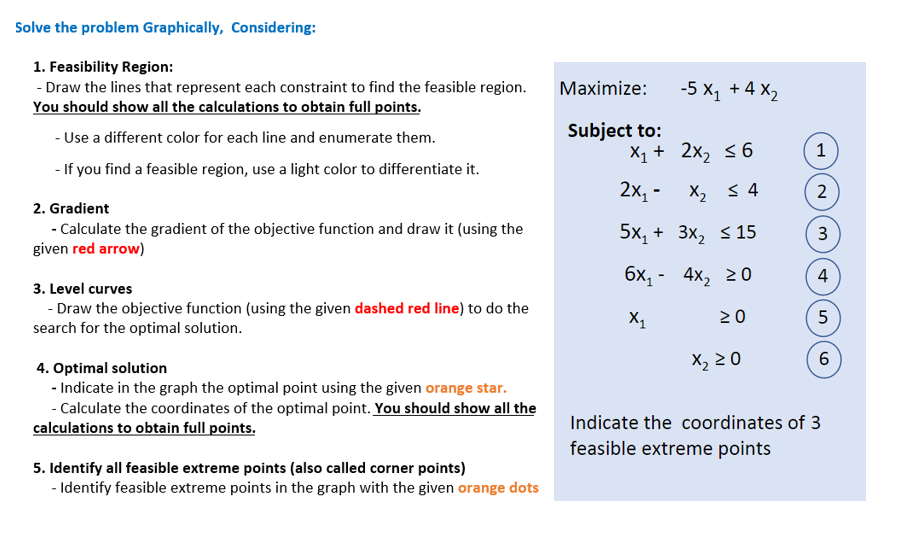
Question: Solve the problem Graphically, Considering: Maximize: -5 X1 + 4 X2 1. Feasibility Region: - Draw the lines that represent each constraint to find the

Solve the problem Graphically, Considering:

Solve the problem Graphically, Considering: Maximize: -5 X1 + 4 X2 1. Feasibility Region: - Draw the lines that represent each constraint to find the feasible region. You should show all the calculations to obtain full points. - Use a different color for each line and enumerate them. - If you find a feasible region, use a light color to differentiate it. 1 Subject to: X1 + 2x2 56 2x- X54 2 2. Gradient - Calculate the gradient of the objective function and draw it (using the given red arrow) 5x2 + 3x2 s 15 3 6x2 - 4x, 20 4 4 3. Level curves - Draw the objective function (using the given dashed red line) to do the search for the optimal solution. X1 20 5 X220 6 4. Optimal solution - Indicate in the graph the optimal point using the given orange star. - Calculate the coordinates of the optimal point. You should show all the calculations to obtain full points. Indicate the coordinates of 3 feasible extreme points 5. Identify all feasible extreme points (also called corner points) - Identify feasible extreme points in the graph with the given orange dots

Step by Step Solution

There are 3 Steps involved in it

1 Expert Approved Answer
Step: 1 Unlock blur-text-image
Question Has Been Solved by an Expert!

Get step-by-step solutions from verified subject matter experts

Step: 2 Unlock
Step: 3 Unlock

Students Have Also Explored These Related General Management Questions!