

Question: solve the question Consider the data in Exercise 1.5 on page 13. Compute the sample variance and the sample standard deviation for both control and
solve the question
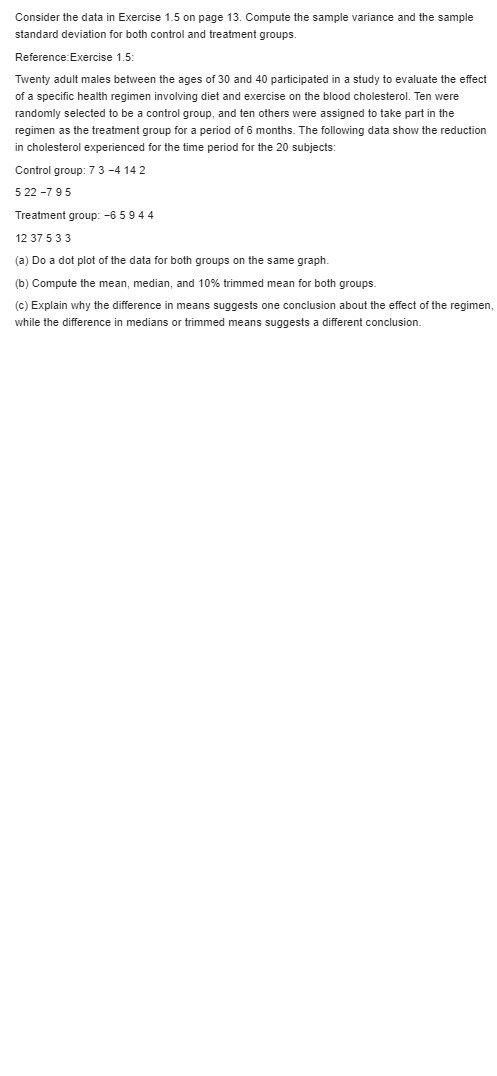
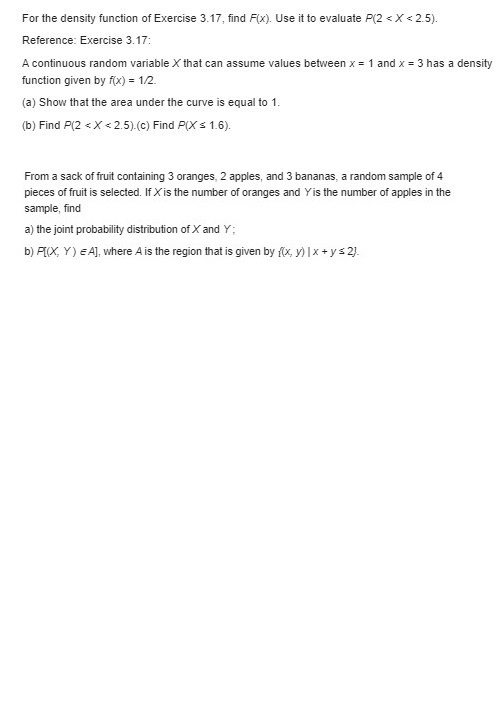
Consider the data in Exercise 1.5 on page 13. Compute the sample variance and the sample standard deviation for both control and treatment groups. Reference Exercise 1.5: Twenty adult males between the ages of 30 and 40 participated in a study to evaluate the effect of a specific health regimen involving diet and exercise on the blood cholesterol. Ten were randomly selected to be a control group, and ten others were assigned to take part in the regimen as the treatment group for a period of 6 months. The following data show the reduction in cholesterol experienced for the time period for the 20 subjects: Control group: 7 3 -4 14 2 522 -7 95 Treatment group: -6 5 9 4 4 12 37 5 3 3 (a) Do a dot plot of the data for both groups on the same graph. (b) Compute the mean, median, and 10% trimmed mean for both groups. (c) Explain why the difference in means suggests one conclusion about the effect of the regimen, while the difference in medians or trimmed means suggests a different conclusion.For the density function of Exercise 3.17, find F(x). Use it to evaluate P(2
Step by Step Solution
There are 3 Steps involved in it

Get step-by-step solutions from verified subject matter experts