

Question: Solve the tax problem using the graph below and list your calculations. Additionally, refer to the 'Who pays the tax?' image and discuss the different
Solve the tax problem using the graph below and list your calculations. Additionally, refer to the 'Who pays the tax?' image and discuss the different scenarios represented by the graphs.
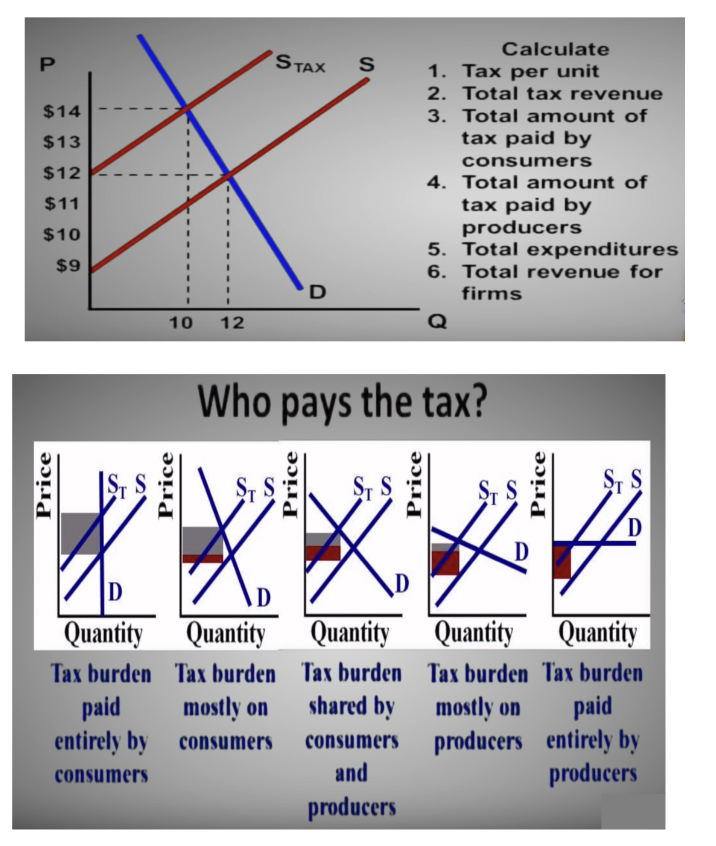
Calculate P STAX S 1. Tax per unit 2. Total tax revenue $14 3. Total amount of $13 tax paid by consumers $12 4. Total amount of $11 tax paid by $10 producers 5. Total expenditures $9 6. Total revenue for D firms 10 12 Q Who pays the tax? Price Price Price Price Price ST S S S ST S ST S Quantity Quantity Quantity Quantity Quantity Tax burden Tax burden Tax burden Tax burden Tax burden paid mostly on shared by mostly on paid entirely by consumers consumers producers entirely by consumers and producers producers
Step by Step Solution
There are 3 Steps involved in it

Get step-by-step solutions from verified subject matter experts