

Question: solve these practice problems According to the article Fatigue Testing of Condoms (Polymer Testing, 2009: 567-571), tests currently used for condoms are surrogates for the
solve these practice problems
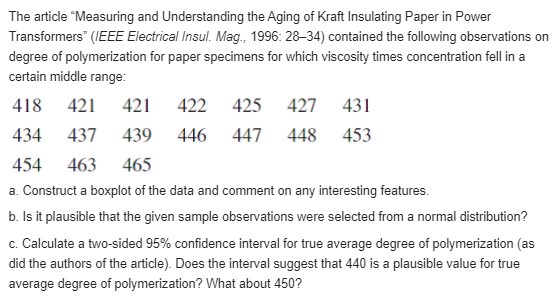
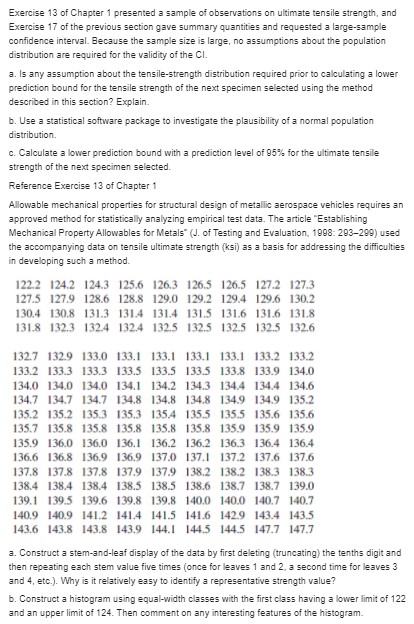
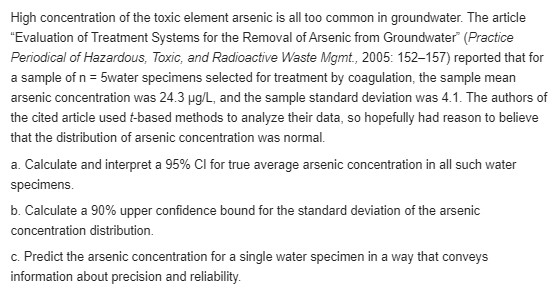
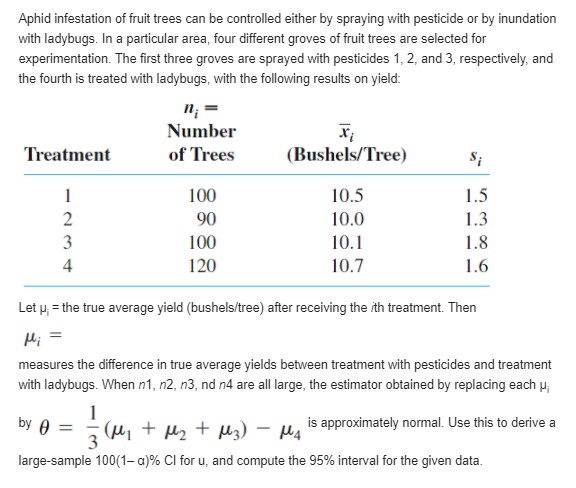
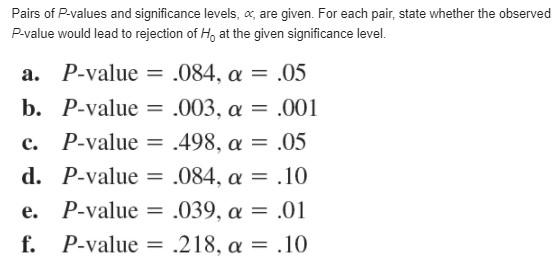
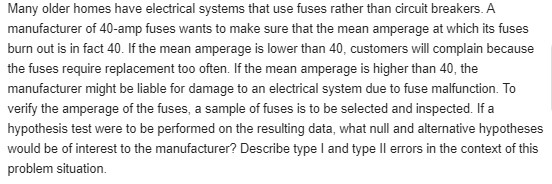
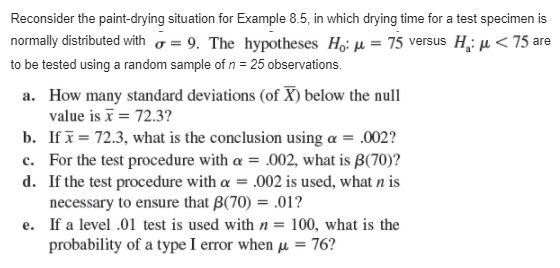
According to the article "Fatigue Testing of Condoms" (Polymer Testing, 2009: 567-571), "tests currently used for condoms are surrogates for the challenges they face in use," including a test for holes, an inflation test, a package seal test, and tests of dimensions and lubricant quality (all fertile territory for the use of statistical methodology!). The investigators developed a new test that adds cyclic strain to a level well below breakage and determines the number of cycles to break. A sample of 20 condoms of one particular type resulted in a sample mean number of 1584 and a sample standard deviation of 607. Calculate and interpret a confidence interval at the 99% confidence level for the true average number of cycles to break. [Note: The article presented the results of hypothesis tests based on the t distribution; the validity of these depends on assuming normal population distributions.]The article "Measuring and Understanding the Aging of Kraft Insulating Paper in Power Transformers" (IEEE Electrical Insul. Mag., 1996: 28-34) contained the following observations on degree of polymerization for paper specimens for which viscosity times concentration fell in a certain middle range: 418 421 421 422 425 427 431 434 437 439 446 447 448 453 454 463 465 a. Construct a boxplot of the data and comment on any interesting features. b. Is it plausible that the given sample observations were selected from a normal distribution? c. Calculate a two-sided 95% confidence interval for true average degree of polymerization (as did the authors of the article). Does the interval suggest that 440 is a plausible value for true average degree of polymerization? What about 450?Exercise 13 of Chapter 1 presented a sample of observations on ultimate tensile strength, and Exercise 17 of the previous section gave summary quantities and requested a large-sample confidence interval. Because the sample size is large, no assumptions about the population distribution are required for the validity of the CI. 3. Is any assumption about the tensile-strength distribution required prior to calculating a lower prediction bound for the tensile strength of the next specimen selected using the method described in this section? Explain. b. Use a statistical software package to investigate the plausibility of a normal population distribution. c. Calculate a lower prediction bound with a prediction level of 95%% for the ultimate tensile strength of the next specimen selected. Reference Exercise 13 of Chapter 1 Allowable mechanical properties for structural design of metallic aerospace vehicles requires an approved method for statistically analyzing empirical test data. The article "Establishing Mechanical Property Allowables for Metals" (J. of Testing and Evaluation, 1098: 203-290) used the accompanying data on tensile ultimate strength (ksi) as a basis for addressing the difficulties in developing such a method. 122.2 124.2 124.3 125.6 126.3 126.5 126.5 127.2 127.3 127.5 127.9 128.6 128.8 129.0 129.2 129.4 129.6 130.2 130.4 130.8 131.3 131.4 131.4 131.5 131.6 131.6 131.8 131.8 132.3 132.4 1324 132.5 132.5 132.5 132.5 132.6 132.7 132.9 133.0 133.1 133.1 133.1 133.1 133.2 133.2 133.2 133.3 133.3 133.5 1335 133.5 133.8 133.9 134.0 134.0 134.0 134.0 134.1 134.2 134.3 134.4 134.4 134.6 134.7 134.7 134.7 134.8 134.8 134.8 134.9 134.9 135.2 135.2 135.2 135.3 135.3 1354 135.5 135.5 135.6 135.6 135.7 135.8 135.8 135.8 135.8 135.8 135.9 135.9 135.9 135.9 136.0 136.0 136.1 136.2 136.2 136.3 136.4 136.4 136.6 136.8 136.9 136.9 137.0 137.1 137.2 137.6 137.6 137.8 137.8 137.8 137.9 137.9 138.2 138.2 1383 138.3 138.4 1384 138.4 138.5 138.5 138.6 138.7 138.7 139.0 139.1 139.5 139.6 139.8 139.8 140.0 140.0 140.7 140.7 140.9 140.9 141.2 141.4 141.5 141.6 142.9 143.4 143.5 143.6 143.8 143.8 143.9 144.1 1445 1445 147.7 147.7 a. Construct a stem-and-leaf display of the data by first deleting (truncating) the tenths digit and then repeating each stem value five times (once for leaves 1 and 2, a second time for leaves 3 and 4, etc.). Why is it relatively easy to identify a representative strength value? b. Construct a histogram using equal-width classes with the first class having a lower limit of 122 and an upper limit of 124. Then comment on any interesting features of the histogram.\fHigh concentration of the toxic element arsenic is all too common in groundwater. The article "Evaluation of Treatment Systems for the Removal of Arsenic from Groundwater" (Practice Periodical of Hazardous, Toxic, and Radioactive Waste Mgmt., 2005: 152-157) reported that for a sample of n = 5water specimens selected for treatment by coagulation, the sample mean arsenic concentration was 24.3 pg/L, and the sample standard deviation was 4.1. The authors of the cited article used f-based methods to analyze their data, so hopefully had reason to believe that the distribution of arsenic concentration was normal. a. Calculate and interpret a 95% Cl for true average arsenic concentration in all such water specimens. b. Calculate a 90% upper confidence bound for the standard deviation of the arsenic concentration distribution. c. Predict the arsenic concentration for a single water specimen in a way that conveys information about precision and reliability.Aphid infestation of fruit trees can be controlled either by spraying with pesticide or by inundation with ladybugs. In a particular area, four different groves of fruit trees are selected for experimentation. The first three groves are sprayed with pesticides 1, 2, and 3, respectively, and the fourth is treated with ladybugs, with the following results on yield: 1; = Number Treatment of Trees (Bushels/Tree) S; 100 10.5 1.5 90 10.0 1.3 A UN- 100 10.1 1.8 120 10.7 1.6 Let p; = the true average yield (bushels/tree) after receiving the ith treatment. Then measures the difference in true average yields between treatment with pesticides and treatment with ladybugs. When n1, n2, n3, nd n4 are all large, the estimator obtained by replacing each ; by A = 7 ( M, + My + us) - u, is approximately normal. Use this to derive a large-sample 100(1-a)% Cl for u, and compute the 95% interval for the given data.Pairs of P-values and significance levels, a are given. For each pair, state whether the observed P-value would lead to rejection of Ho at the given significance level. a. P-value = .084, a = .05 b. P-value = .003, a = .001 c. P-value = .498, a = .05 d. P-value = .084, a = .10 e. P-value = .039, a = .01 f. P-value = .218, a = .10Many older homes have electrical systems that use fuses rather than circuit breakers. A manufacturer of 40-amp fuses wants to make sure that the mean amperage at which its fuses burn out is in fact 40. If the mean amperage is lower than 40, customers will complain because the fuses require replacement too often. If the mean amperage is higher than 40, the manufacturer might be liable for damage to an electrical system due to fuse malfunction. To verify the amperage of the fuses, a sample of fuses is to be selected and inspected. If a hypothesis test were to be performed on the resulting data, what null and alternative hypotheses would be of interest to the manufacturer? Describe type I and type II errors in the context of this problem situation.Reconsider the paint-drying situation for Example 8.5, in which drying time for a test specimen is normally distributed with or = 9. The hypotheses Hou = 75 versus Hou
Step by Step Solution
There are 3 Steps involved in it

Get step-by-step solutions from verified subject matter experts