

Question: solve these practice problems The time to failure in hours of an important piece of electronic equipment used in a manufactured DVD player has the
solve these practice problems
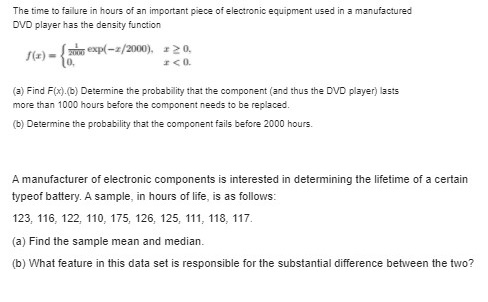
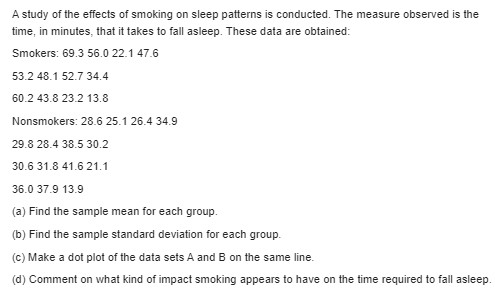
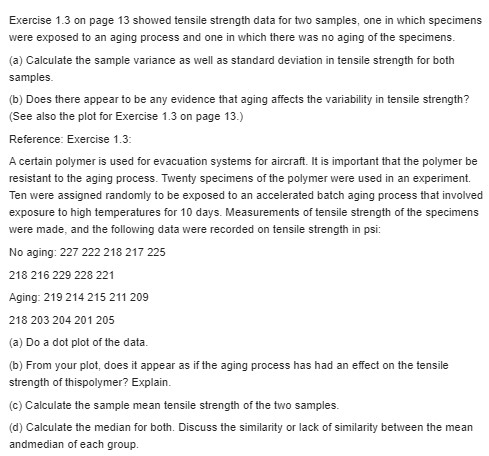
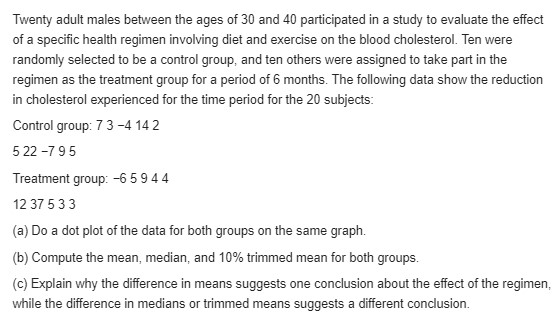
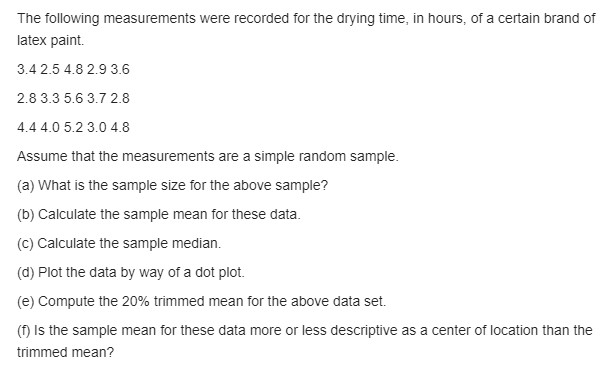
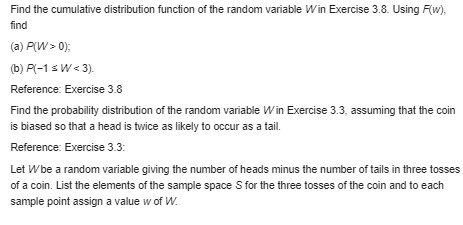
The time to failure in hours of an important piece of electronic equipment used in a manufactured DVD player has the density function (x) 3005 xp(-2/2000), a 2 0. (3) Find F(x).(b) Determine the probability that the component (and thus the DVD player) lasts more than 1000 hours before the component needs to be replaced. (b) Determine the probability that the component fails before 2000 hours. A manufacturer of electronic components is interested in determining the lifetime of a certain typeof battery. A sample, in hours of life, is as follows: 123, 116, 122, 110, 175, 126, 125, 111, 118, 117. (a) Find the sample mean and median. (b) What feature in this data set is responsible for the substantial difference between the two?\fA study of the effects of smoking on sleep patterns is conducted. The measure observed is the time, in minutes, that it takes to fall asleep. These data are obtained: Smokers: 69.3 56.0 22.1 47.6 53.2 48.1 52.7 34.4 60.2 43.8 23.2 13.8 Nonsmokers: 28.6 25.1 26.4 34.9 29.8 28.4 38.5 30.2 30.6 31.8 41.6 21.1 36.0 37.9 13.9 (a) Find the sample mean for each group. (b) Find the sample standard deviation for each group. (c) Make a dot plot of the data sets A and B on the same line. (d) Comment on what kind of impact smoking appears to have on the time required to fall asleep.Exercise 1.3 on page 13 showed tensile strength data for two samples, one in which specimens were exposed to an aging process and one in which there was no aging of the specimens. (a) Calculate the sample variance as well as standard deviation in tensile strength for both samples. (b) Does there appear to be any evidence that aging affects the variability in tensile strength? (See also the plot for Exercise 1.3 on page 13.) Reference: Exercise 1.3: A certain polymer is used for evacuation systems for aircraft. It is important that the polymer be resistant to the aging process. Twenty specimens of the polymer were used in an experiment. Ten were assigned randomly to be exposed to an accelerated batch aging process that involved exposure to high temperatures for 10 days. Measurements of tensile strength of the specimens were made, and the following data were recorded on tensile strength in psi: No aging: 227 222 218 217 225 218 216 229 228 221 Aging: 219 214 215 211 209 218 203 204 201 205 (a) Do a dot plot of the data. (b) From your plot, does it appear as if the aging process has had an effect on the tensile strength of thispolymer? Explain. (c) Calculate the sample mean tensile strength of the two samples. (d) Calculate the median for both. Discuss the similarity or lack of similarity between the mean andmedian of each group.Twenty adult males between the ages of 30 and 40 participated in a study to evaluate the effect of a specific health regimen involving diet and exercise on the blood cholesterol. Ten were randomly selected to be a control group, and ten others were assigned to take part in the regimen as the treatment group for a period of 6 months. The following data show the reduction in cholesterol experienced for the time period for the 20 subjects: Control group: 7 3 -4 14 2 522 -795 Treatment group: -6 5 94 4 12 37 53 3 (a) Do a dot plot of the data for both groups on the same graph. (b) Compute the mean, median, and 10% trimmed mean for both groups. (c) Explain why the difference in means suggests one conclusion about the effect of the regimen, while the difference in medians or trimmed means suggests a different conclusion.The following measurements were recorded for the drying time, in hours, of a certain brand of latex paint. 3.4 2.5 4.8 2.9 3.6 2.8 3.3 5.6 3.7 2.8 4.4 4.0 5.2 3.0 4.8 Assume that the measurements are a simple random sample. (a) What is the sample size for the above sample? (b) Calculate the sample mean for these data. (c) Calculate the sample median. (d) Plot the data by way of a dot plot. (e) Compute the 20% trimmed mean for the above data set. (f) Is the sample mean for these data more or less descriptive as a center of location than the trimmed mean?Find the cumulative distribution function of the random variable Win Exercise 3.8. Using A(w). find (@) P(W = 0). (b) P(-1
Step by Step Solution
There are 3 Steps involved in it

Get step-by-step solutions from verified subject matter experts