

Question: solve these problems of probability For Exercise 1.6 on page 13, compute the sample standard deviation in tensile strength for the samples separately for the
solve these problems of probability
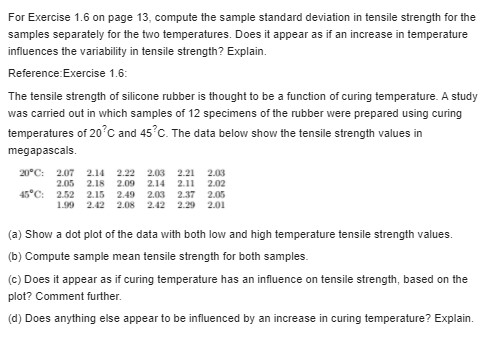

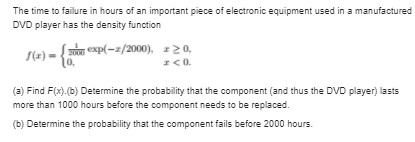
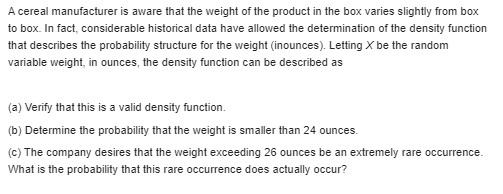
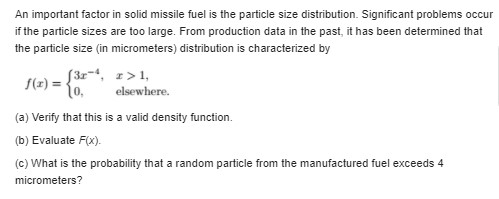
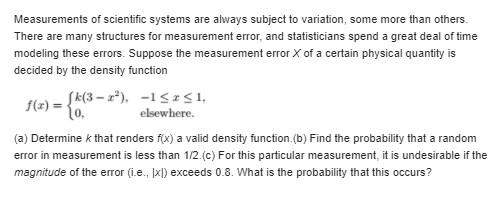
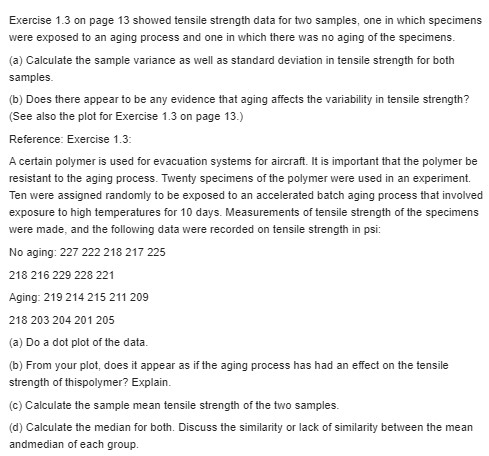
For Exercise 1.6 on page 13, compute the sample standard deviation in tensile strength for the samples separately for the two temperatures. Does it appear as if an increase in temperature influences the variability in tensile strength? Explain. Reference Exercise 1.6: The tensile strength of silicone rubber is thought to be a function of curing temperature. A study was carried out in which samples of 12 specimens of the rubber were prepared using curing temperatures of 20 C and 45 C. The data below show the tensile strength values in megapascals. 20"C: 2.07 2.14 2.22 2.03 2.21 2.013 2.05 2.18 2.09 2.14 2.11 2.02 45"C: 2.52 2.15 2.49 2.03 2.37 2.05 2.42 2.08 2.42 2.20 2.01 (a) Show a dot plot of the data with both low and high temperature tensile strength values. (b) Compute sample mean tensile strength for both samples. (c) Does it appear as if curing temperature has an influence on tensile strength, based on the plot? Comment further. (d) Does anything else appear to be influenced by an increase in curing temperature? Explain.From a box containing 4 black balls and 2 green balls, 3 balls are drawn in succession, each ball being replaced in the box before the next draw is made. Find the probability distribution for the number of green balls.The time to failure in hours of an important piece of electronic equipment used in a manufactured DVD player has the density function -x/2000), + 20. (3) Find F(x).(b) Determine the probability that the component (and thus the DVD player) lasts more than 1000 hours before the component needs to be replaced. (b) Determine the probability that the component fails before 2000 hours.A cereal manufacturer is aware that the weight of the product in the box varies slightly from box to box. In fact, considerable historical data have allowed the determination of the density function that describes the probability structure for the weight (inounces). Letting X be the random variable weight, in ounces, the density function can be described as (a) Verify that this is a valid density function. (b) Determine the probability that the weight is smaller than 24 ounces. (c) The company desires that the weight exceeding 26 ounces be an extremely rare occurrence. What is the probability that this rare occurrence does actually occur?An important factor in solid missile fuel is the particle size distribution. Significant problems occur if the particle sizes are too large. From production data in the past, it has been determined that the particle size (in micrometers) distribution is characterized by (3r, 1>1, elsewhere. (a) Verify that this is a valid density function. (b) Evaluate F(x). (c) What is the probability that a random particle from the manufactured fuel exceeds 4 micrometers?Measurements of scientific systems are always subject to variation, some more than others. There are many structures for measurement error, and statisticians spend a great deal of time modeling these errors. Suppose the measurement error X of a certain physical quantity is decided by the density function f(z) = 10. k(3-r'), -15251, elsewhere. (a) Determine * that renders f(x) a valid density function.(b) Find the probability that a random error in measurement is less than 1/2.(c) For this particular measurement, it is undesirable if the magnitude of the error (ie., (x]) exceeds 0.8. What is the probability that this occurs?Exercise 1.3 on page 13 showed tensile strength data for two samples, one in which specimens were exposed to an aging process and one in which there was no aging of the specimens. (a) Calculate the sample variance as well as standard deviation in tensile strength for both samples. (b) Does there appear to be any evidence that aging affects the variability in tensile strength? (See also the plot for Exercise 1.3 on page 13.) Reference: Exercise 1.3: A certain polymer is used for evacuation systems for aircraft. It is important that the polymer be resistant to the aging process. Twenty specimens of the polymer were used in an experiment. Ten were assigned randomly to be exposed to an accelerated batch aging process that involved exposure to high temperatures for 10 days. Measurements of tensile strength of the specimens were made, and the following data were recorded on tensile strength in psi: No aging: 227 222 218 217 225 218 216 229 228 221 Aging: 219 214 215 211 209 218 203 204 201 205 (a) Do a dot plot of the data. (b) From your plot, does it appear as if the aging process has had an effect on the tensile strength of thispolymer? Explain. (c) Calculate the sample mean tensile strength of the two samples. (d) Calculate the median for both. Discuss the similarity or lack of similarity between the mean andmedian of each group
Step by Step Solution
There are 3 Steps involved in it

Get step-by-step solutions from verified subject matter experts