

Question: Solve these problems and upload your solution to Canvas. You can solve them by hand or using Excel. Show all your work ( typed
Solve these problems and upload your solution to Canvas. You can solve them by hand" or
using Excel.
Show all your work typed in the document or pasting a scanned image of your handwritten
solution Save your solution document in a pdf file and upload it to Canvas along with an
Excel file for calculations performed in Excel.
Problem points
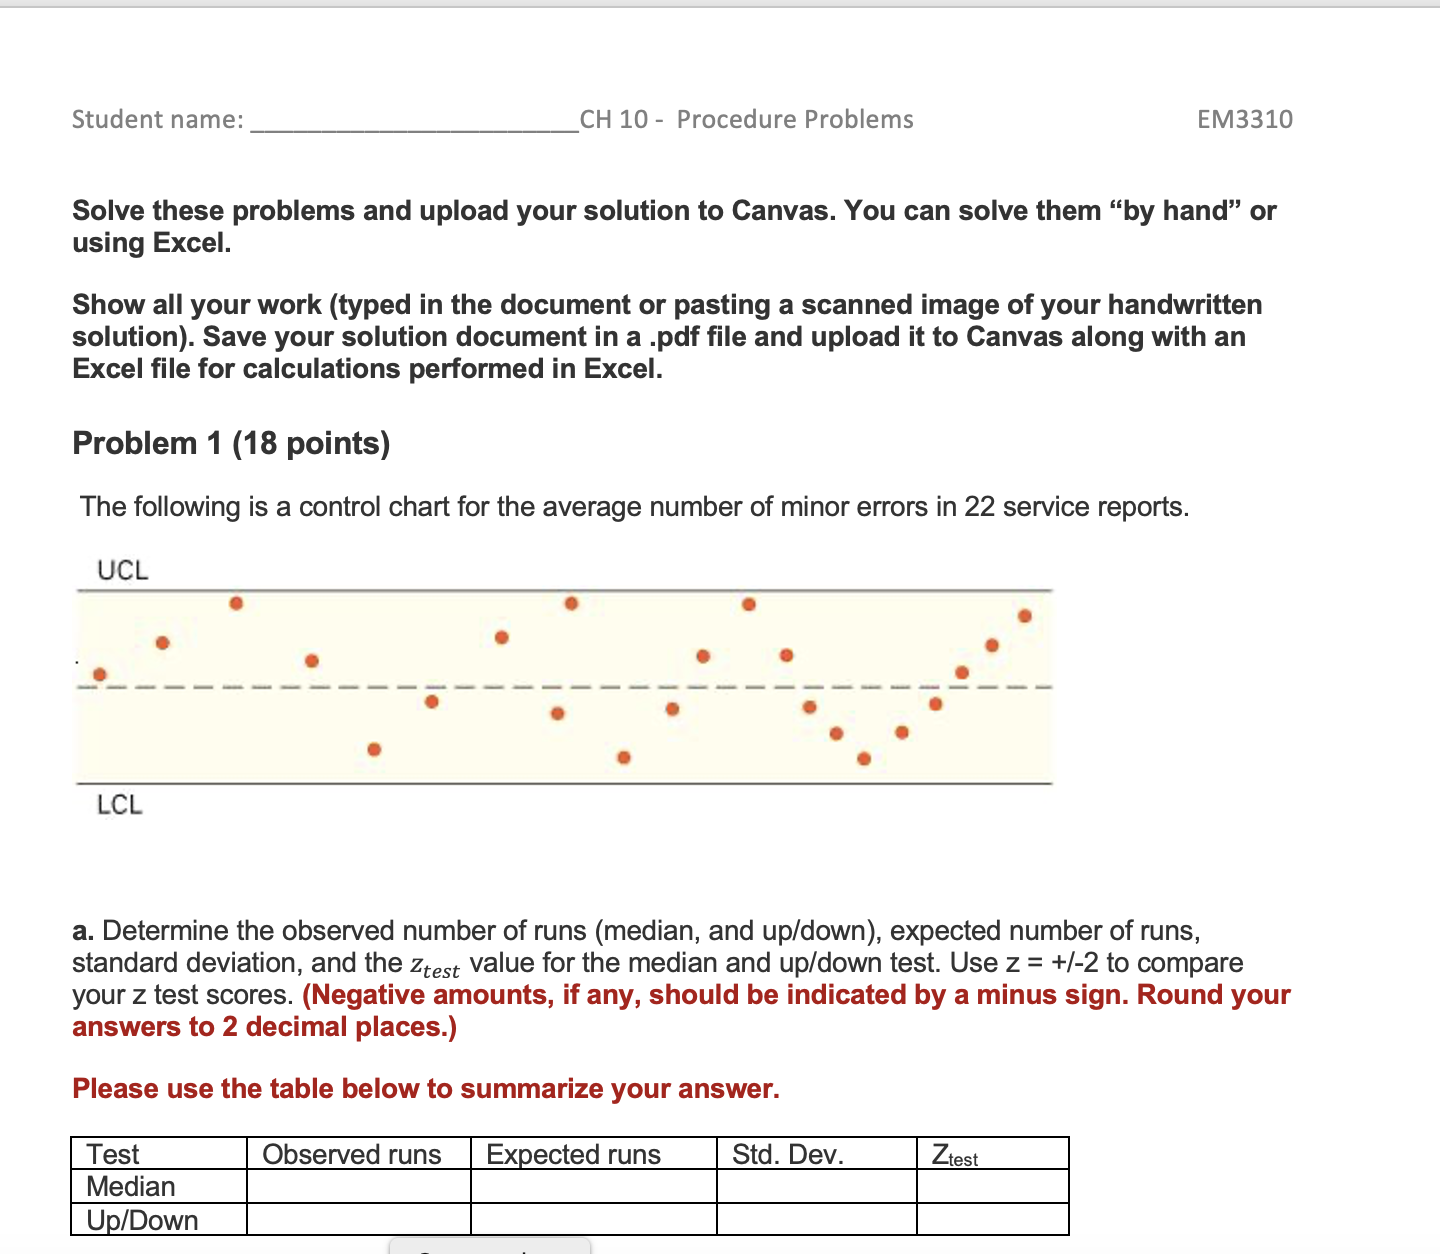
The following is a control chart for the average number of minor errors in service reports.
a Determine the observed number of runs median and updown expected number of runs,
standard deviation, and the ztest value for the median and updown test. Use z to compare
your z test scores. Negative amounts, if any, should be indicated by a minus sign. Round your
answers to decimal places.
Please use the table below to summarize your answer.bBased on your calculations, conclude whether the test is random or nonrandom. Use the criteria of associated to a confidence level to evaluate if there is nonrandom error.
Test
Conclusion Random or Nonrandom
Median
UpDown
c Should the process be investigated due to nonrandom variation? Yes or No
Problem points
The Healthy Chocolate Company makes a variety of chocolate candies, including a ounce chocolate bar grams and a box of six ounce chocolate bars grams
aSpecifications for the ounce bar are grams to grams. What is the largest standard deviation in grams that the machine that fills the bar molds can have and still be considered capable if the average fill is grams?Round your intermediate calculations to decimal places and final answer to decimal places.
Standard deviation: grams.
Problem points
As part of an insurance companys training program, participants learn how to conduct an analysis of clients insurability. The goal is to have participants achieve a time in the range of to minutes. Test results for three participants were the following: Armand, a mean of minutes and a standard deviation of minutes; Jerry, a mean of minutes and a standard deviation of minutes; and Melissa, a mean of minutes and a standard deviation of minutes.
aCompute process capability forthe participants and determine whether each is capable.Do not round intermediate calculations. Round your answers to decimal places.
Participant
Cpk
Cp
Armand
Jerry
Melissa
Problem points
Processing times for new accounts at an investing firm are provided in the file Ch Procedure Problems P data.xlsx Twenty samples of five observations each have been taken. Use the sample data in conjunction with Table in our textbook to construct upper and lower control limits for a mean chart. Do the results suggest that the process is in control? Why or why not? Hint: Consider Solved Problem in page in our textbook as you work on this problem. I highly suggest you use Excel to solve this problem.
Step by Step Solution
There are 3 Steps involved in it
1 Expert Approved Answer
Step: 1 Unlock

Question Has Been Solved by an Expert!
Get step-by-step solutions from verified subject matter experts
Step: 2 Unlock
Step: 3 Unlock