

Question: solve these problems The difference between the number of customers in line at the express checkout and the number in line at the superexpress checkout
solve these problems
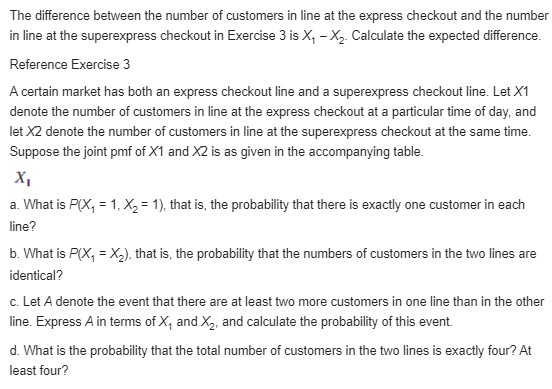
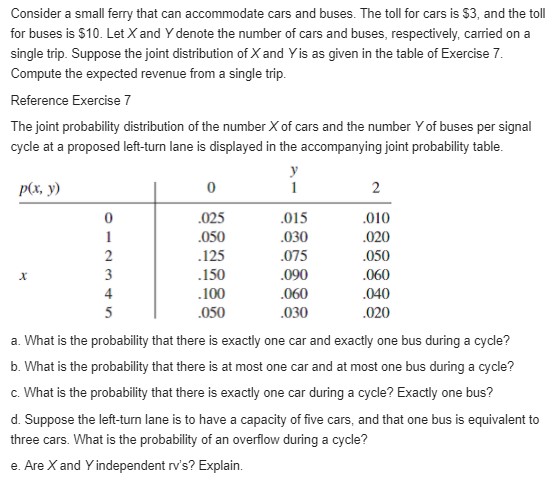
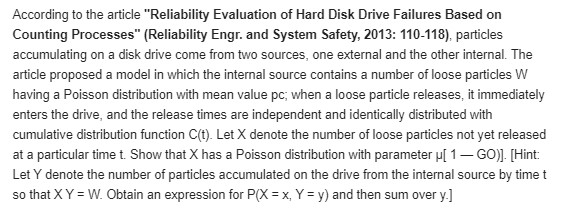
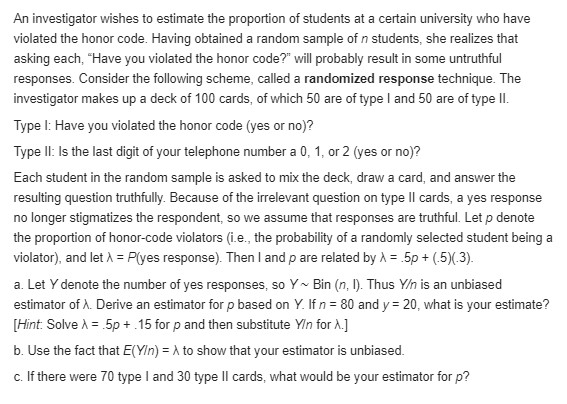
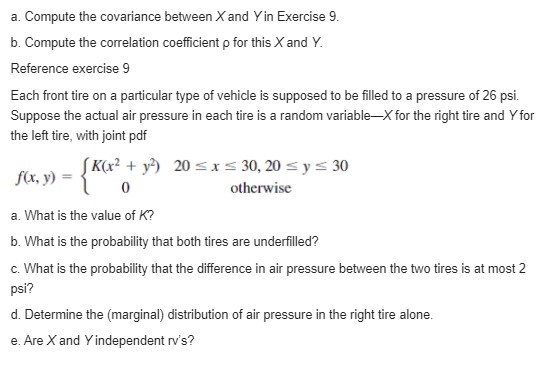
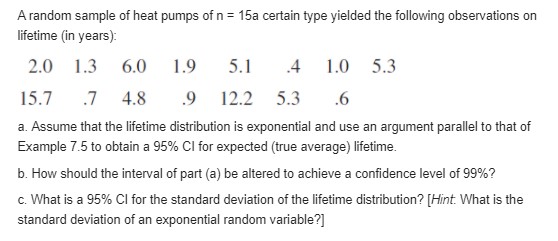
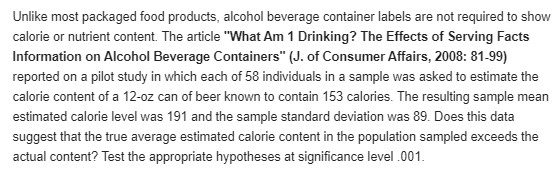
The difference between the number of customers in line at the express checkout and the number in line at the superexpress checkout in Exercise 3 is X, - X2 Calculate the expected difference. Reference Exercise 3 A certain market has both an express checkout line and a superexpress checkout line. Let X1 denote the number of customers in line at the express checkout at a particular time of day, and let X2 denote the number of customers in line at the superexpress checkout at the same time. Suppose the joint pmf of X1 and X2 is as given in the accompanying table. X a. What is P(X, = 1, X, = 1), that is, the probability that there is exactly one customer in each line? b. What is P(X, = X,), that is, the probability that the numbers of customers in the two lines are identical? c. Let A denote the event that there are at least two more customers in one line than in the other line. Express A in terms of X, and X2, and calculate the probability of this event. d. What is the probability that the total number of customers in the two lines is exactly four? At least four?Consider a small ferry that can accommodate cars and buses. The toll for cars is $3, and the toll for buses is $10. Let X and Y denote the number of cars and buses, respectively, carried on a single trip. Suppose the joint distribution of X and Yis as given in the table of Exercise 7. Compute the expected revenue from a single trip. Reference Exercise 7 The joint probability distribution of the number X of cars and the number Y of buses per signal cycle at a proposed left-turn lane is displayed in the accompanying joint probability table. p(x, y) 0 .025 .015 010 .050 .030 020 .125 .075 050 .150 .090 .060 .100 .060 040 .050 .030 .020 a. What is the probability that there is exactly one car and exactly one bus during a cycle? b. What is the probability that there is at most one car and at most one bus during a cycle? c. What is the probability that there is exactly one car during a cycle? Exactly one bus? d. Suppose the left-turn lane is to have a capacity of five cars, and that one bus is equivalent to three cars. What is the probability of an overflow during a cycle? e. Are X and Y independent rv's? Explain.According to the article "Reliability Evaluation of Hard Disk Drive Failures Based on Counting Processes" (Reliability Engr. and System Safety, 2013: 110-118), particles accumulating on a disk drive come from two sources, one external and the other internal. The article proposed a model in which the internal source contains a number of loose particles W having a Poisson distribution with mean value pc; when a loose particle releases, it immediately enters the drive, and the release times are independent and identically distributed with cumulative distribution function C(t). Let X denote the number of loose particles not yet released at a particular time t. Show that X has a Poisson distribution with parameter p[ 1 - GO)]. [Hint: Let Y denote the number of particles accumulated on the drive from the internal source by time t so that X Y = W. Obtain an expression for P(X = x, Y = y) and then sum over y.]An investigator wishes to estimate the proportion of students at a certain university who have violated the honor code. Having obtained a random sample of n students, she realizes that asking each, "Have you violated the honor code?" will probably result in some untruthful responses. Consider the following scheme, called a randomized response technique. The investigator makes up a deck of 100 cards, of which 50 are of type I and 50 are of type II. Type I: Have you violated the honor code (yes or no)? Type II: Is the last digit of your telephone number a 0, 1, or 2 (yes or no)? Each student in the random sample is asked to mix the deck, draw a card, and answer the resulting question truthfully. Because of the irrelevant question on type II cards, a yes response no longer stigmatizes the respondent, so we assume that responses are truthful. Let p denote the proportion of honor-code violators (i.e., the probability of a randomly selected student being a violator), and let A = P(yes response). Then I and p are related by A = .5p + (.5)(.3). a. Let Y denote the number of yes responses, so Y ~ Bin (n, I). Thus Y is an unbiased estimator of A. Derive an estimator for p based on Y. Ifn = 80 and y = 20, what is your estimate? [Hint: Solve ) = .5p + .15 for p and then substitute YIn for A.] b. Use the fact that E(VIn) = A to show that your estimator is unbiased. c. If there were 70 type I and 30 type II cards, what would be your estimator for p?a. Compute the covariance between X and Yin Exercise 9. b. Compute the correlation coefficient p for this X and Y. Reference exercise 9 Each front tire on a particular type of vehicle is supposed to be filled to a pressure of 26 psi. Suppose the actual air pressure in each tire is a random variable-X for the right tire and Y for the left tire, with joint pdf f(x, y) [K(x2 + y-) 20 s x = 30, 20 = y = 30 0 otherwise a. What is the value of K? b. What is the probability that both tires are underfilled? c. What is the probability that the difference in air pressure between the two tires is at most 2 psi? d. Determine the (marginal) distribution of air pressure in the right tire alone. e. Are X and Y independent rv's?A random sample of heat pumps of n = 15a certain type yielded the following observations on lifetime (in years): 2.0 1.3 6.0 1.9 5.1 .4 1.0 5.3 15.7 .7 4.8 .9 12.2 5.3 .6 a. Assume that the lifetime distribution is exponential and use an argument parallel to that of Example 7.5 to obtain a 95% Cl for expected (true average) lifetime. b. How should the interval of part (a) be altered to achieve a confidence level of 99%? c. What is a 95% Cl for the standard deviation of the lifetime distribution? [Hint. What is the standard deviation of an exponential random variable?]Unlike most packaged food products, alcohol beverage container labels are not required to show calorie or nutrient content. The article "What Am 1 Drinking? The Effects of Serving Facts Information on Alcohol Beverage Containers" (J. of Consumer Affairs, 2008: 81-99) reported on a pilot study in which each of 58 individuals in a sample was asked to estimate the calorie content of a 12-oz can of beer known to contain 153 calories. The resulting sample mean estimated calorie level was 191 and the sample standard deviation was 89. Does this data suggest that the true average estimated calorie content in the population sampled exceeds the actual content? Test the appropriate hypotheses at significance level .001
Step by Step Solution
There are 3 Steps involved in it

Get step-by-step solutions from verified subject matter experts