

Question: Solve this question and label all answers clearly. The rectangles in the graph below illustrate a right endpoint Riemann sum for f(x) = 5 -
Solve this question and label all answers clearly.
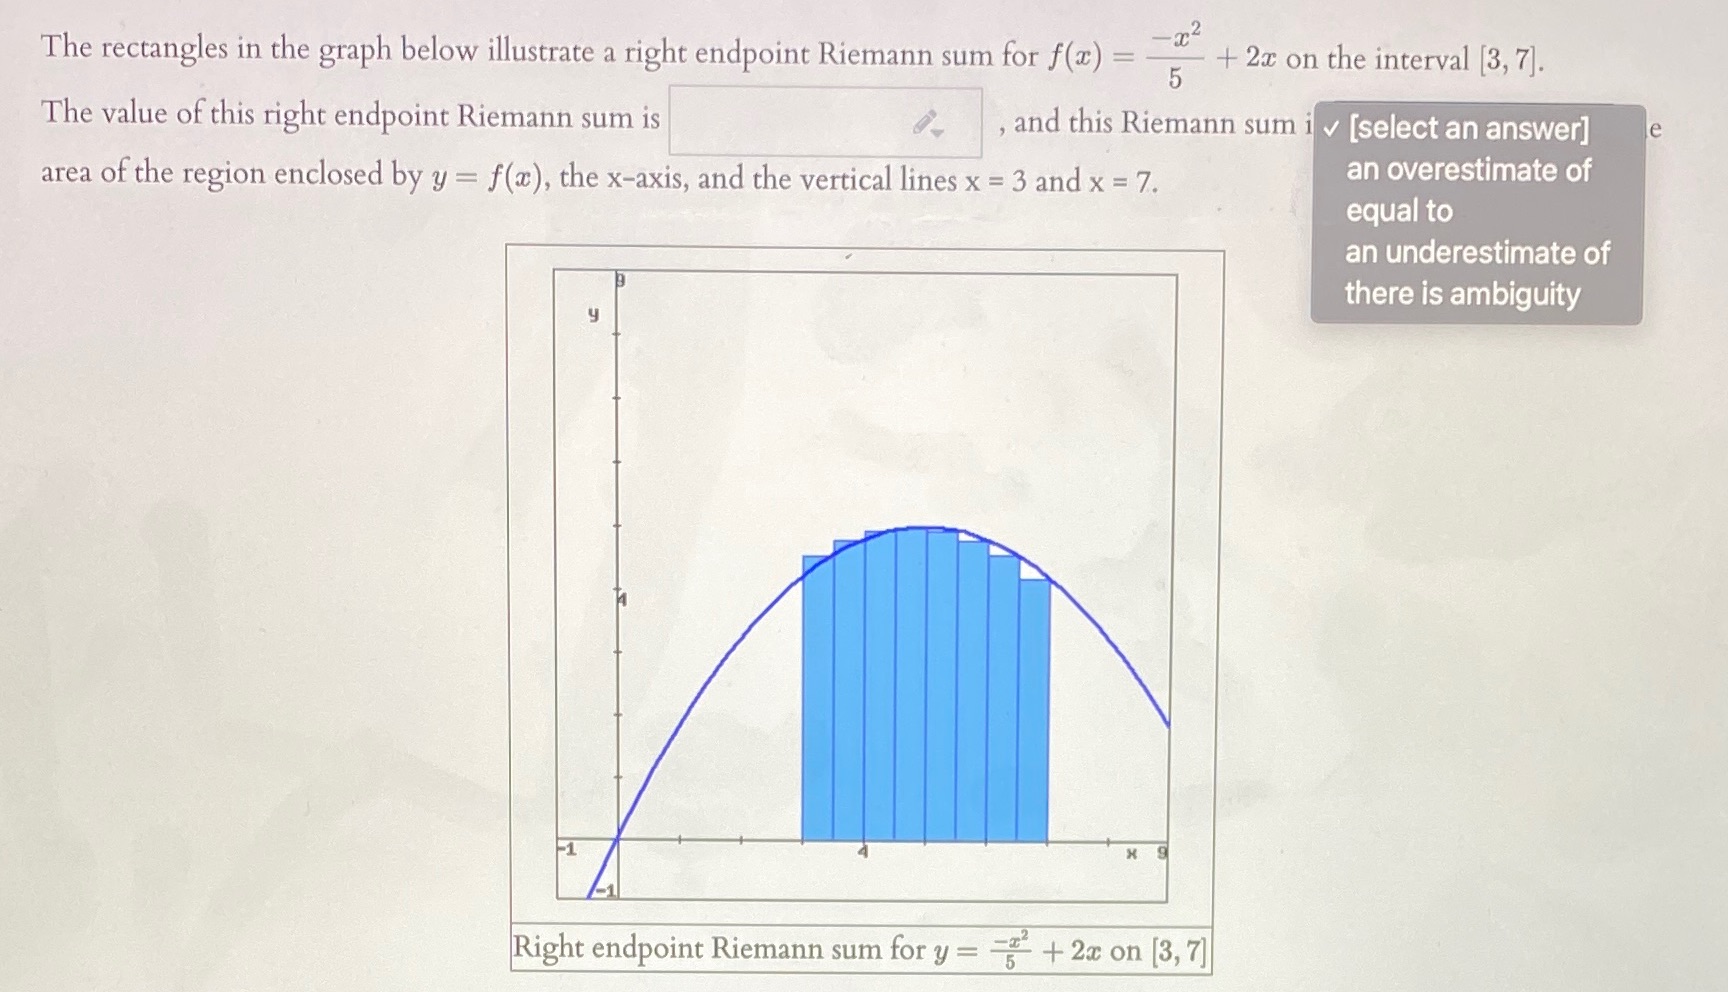
The rectangles in the graph below illustrate a right endpoint Riemann sum for f(x) = 5 - + 2x on the interval [3, 7]. The value of this right endpoint Riemann sum is , and this Riemann sum i v [select an answer] area of the region enclosed by y = f(x), the x-axis, and the vertical lines x = 3 and x = 7. an overestimate of equal to an underestimate of there is ambiguity Right endpoint Riemann sum for y = = + 2x on [3, 7]
Step by Step Solution
There are 3 Steps involved in it
1 Expert Approved Answer
Step: 1 Unlock

Question Has Been Solved by an Expert!
Get step-by-step solutions from verified subject matter experts
Step: 2 Unlock
Step: 3 Unlock