

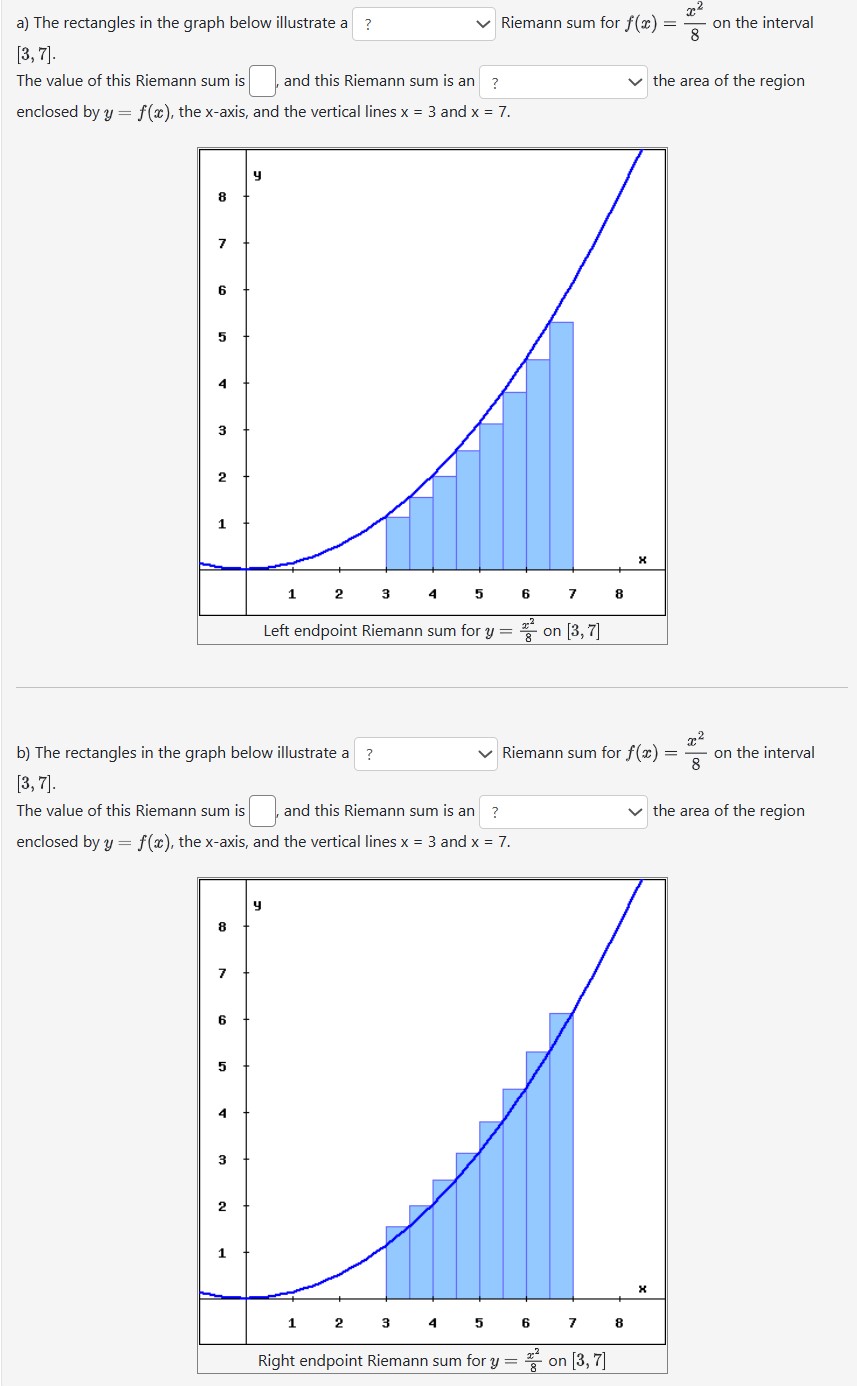
Question: a) The rectangles in the graph below illustrate a ? Riemann sum for f(2) = 8 on the interval [3, 7]. The value of this
![sum for f(2) = 8 on the interval [3, 7]. The value](https://s3.amazonaws.com/si.experts.images/answers/2024/06/6664579d92b6b_0616664579d7cef7.jpg)


![endpoint Riemann sum for y = on [3, 7] b) The rectangles](https://s3.amazonaws.com/si.experts.images/answers/2024/06/6664579f60eee_0636664579f4df8c.jpg)
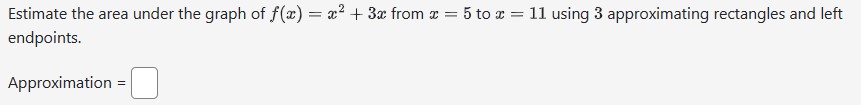
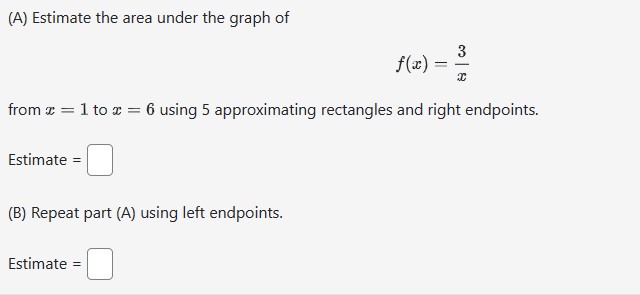
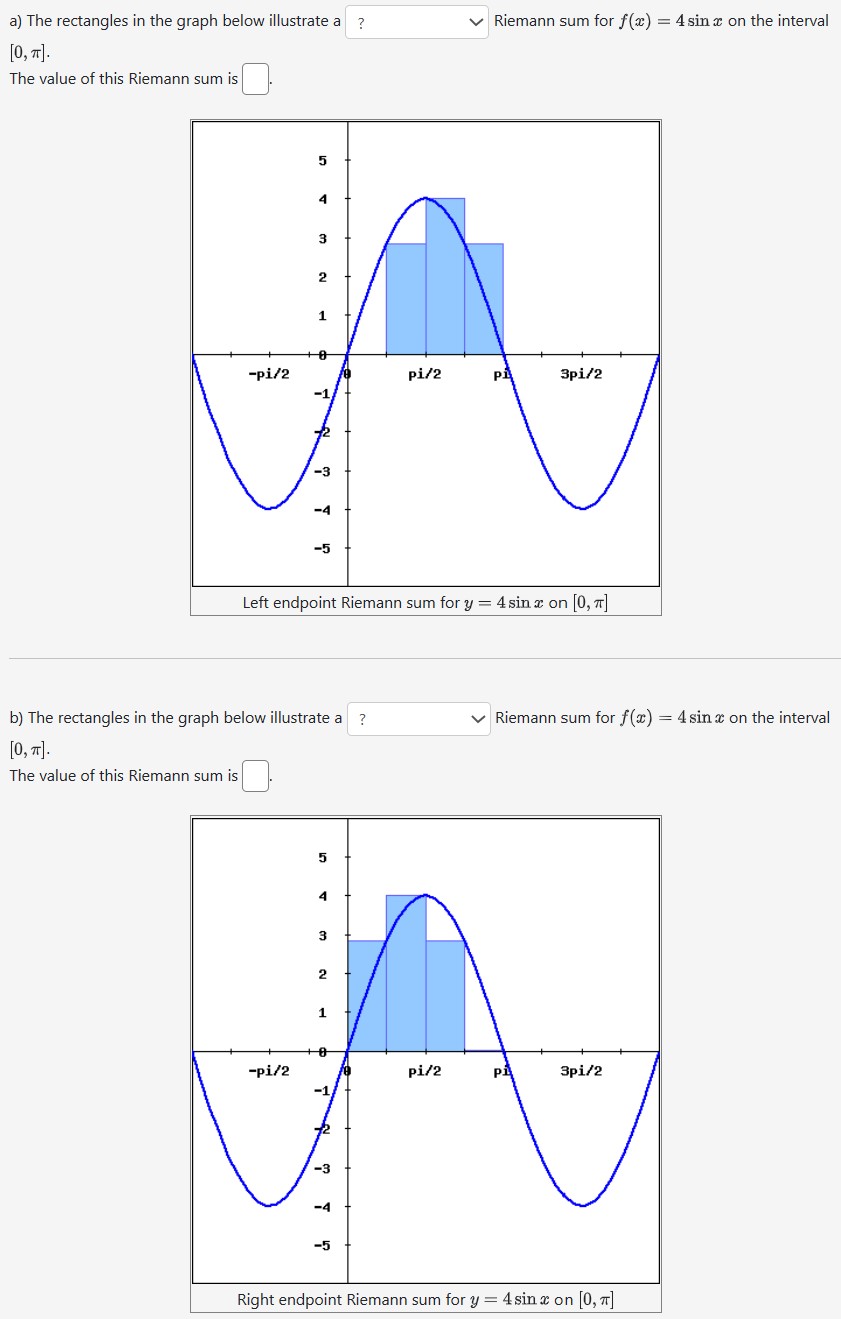
a) The rectangles in the graph below illustrate a ? Riemann sum for f(2) = 8 on the interval [3, 7]. The value of this Riemann sum is and this Riemann sum is an ? the area of the region enclosed by y = f(3), the x-axis, and the vertical lines x = 3 and x = 7. 8 6 A 3 1 X 2 3 5 6 7 8 Left endpoint Riemann sum for y = on [3, 7] b) The rectangles in the graph below illustrate a ? Riemann sum for f (z) = 8 on the interval [3, 7]. The value of this Riemann sum is , and this Riemann sum is an ? the area of the region enclosed by y = f(3), the x-axis, and the vertical lines x = 3 and x = 7. 7 6 1 2 3 5 6 7 8 Right endpoint Riemann sum for y = - on [3, 7]a) The rectangles in the graph below illustrate a ? Riemann sum for f() = 4 sina on the interval [0, TT]. The value of this Riemann sum is A 2 1 -pi/2 pi/2 Pi 3pi/2 -1 -4 -5 Left endpoint Riemann sum for y = 4 sin x on [0, 7] b) The rectangles in the graph below illustrate a ? Riemann sum for f(x) = 4 sin x on the interval [0, TT]. The value of this Riemann sum is 4 2 1 -pi/2 pi/2 pi 3pi/2 -1 -3 -4 -5 Right endpoint Riemann sum for y = 4 sin x on [0, 7](A) Estimate the area under the graph of re) E from x = 1 to I = ti using 5 approximating rectangles and right endpoints. Estimate = I I [B] Repeat part (A) using left endpoints. Estimate = I I Estimate the area under the graph ofz) : x2 + 32: from x .: 5 to :c 2 11 using 3 approximating rectangies and left endpoints. Approximation = D
Step by Step Solution
There are 3 Steps involved in it

Get step-by-step solutions from verified subject matter experts