

Question: Solve through SPSS and explain the steps? le Edit View Data Transform Analyze Graphs Utilities Extensions Window Help 123 2 3 4 5 6 7
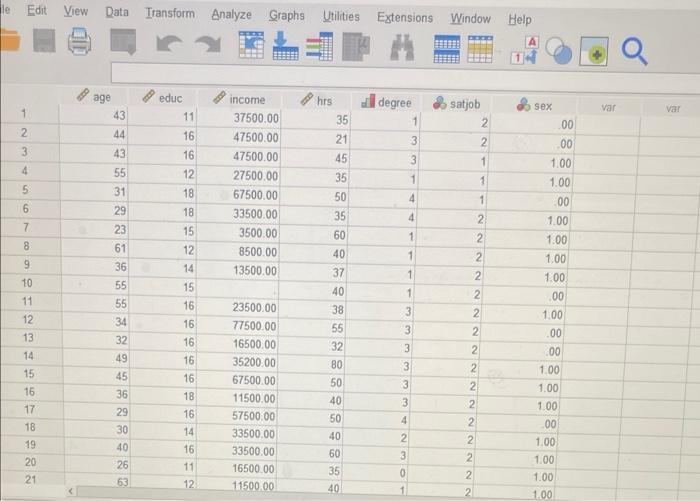
le Edit View Data Transform Analyze Graphs Utilities Extensions Window Help 123 2 3 4 5 6 7 8 9 10 11 12 13 14 15 16 17 18 19 20 21 age 6329522084865 44 31 61 45 36 29 30 40 26 63 mmm educ 11 16 16 12 18 18 15 12 14 15 16 16 66 16 16 16 18 16 14 612 11 income 37500.00 47500.00 47500.00 27500.00 67500.00 33500.00 3500.00 8500.00 13500.00 23500.00 77500.00 16500.00 35200.00 67500.00 11500.00 57500.00 33500.00 33500.00 16500.00 11500.00 hrs 35 21 45 35 50 35 60 40 37 40 38 55 32 80 50 40 50 40 60 35 40 degree 1 11 1 3 3 3 3 3 1 4 4 1 3 4 1 3 3 2 3 0 satjob 2 2 2 2 2 2 2 2 2 1 1 2 2 2 2 2 2 1 2 2 sex .00 .00 1.00 1.00 .00 1.00 1.00 1.00 1.00 .00 1.00 .00 .00 1.00 1.00 1.00 00 1.00 1.00 1.00 1.00 var Q var
Step by Step Solution
3.56 Rating (149 Votes )
There are 3 Steps involved in it
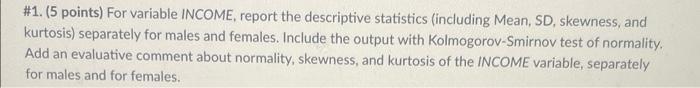
Descriptive statistics for the income variable separately for males and females Variable Males Femal... View full answer

Get step-by-step solutions from verified subject matter experts