

Question: SOLVE USING EXCEL PLEASE Problem 1. The traffic manager of the Monarch Electric Company has just received a rate reduction offer from a trucking company
SOLVE USING EXCEL PLEASE
Problem 1. The traffic manager of the Monarch Electric Company has just received a rate reduction offer from a trucking company for the shipment of fractional horsepower motors to the companys field warehouse. The proposal is a rate of $3 per hundredweight/cwt if a minimum of 40,000 pound is moved. Currently, shipments of 20,000 pounds or more are moved at a rate of $5 per cwt. If the shipment size falls below 20,000 pounds, a rate of $9 per cwt applies. The annual demand on warehouse is 5,000 motors per year Warehouse replenishment orders is 43 orders per year Weight of each motor is 175 lb per motor Standard cost of motor in warehouse $200 per motor Stock replenishment order handling costs is $15 per order Inventory carrying costs as a percentage of average value is 25% per year Handling cost at warehouse is $.30 per cwt Warehouse space is unlimited Should the company implement the new rate? Please solve the problem consider the shipping cost and the costs in the warehouse (inventory carrying cost and ordering cost) using total annual cost as the criteria.
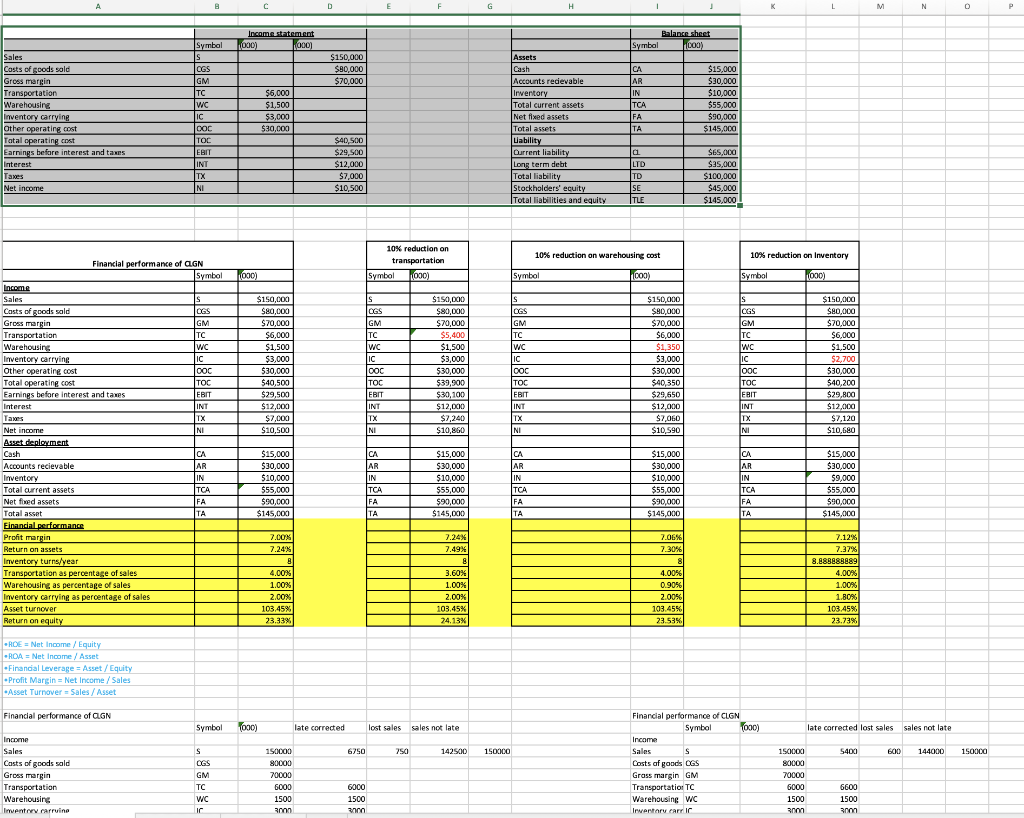
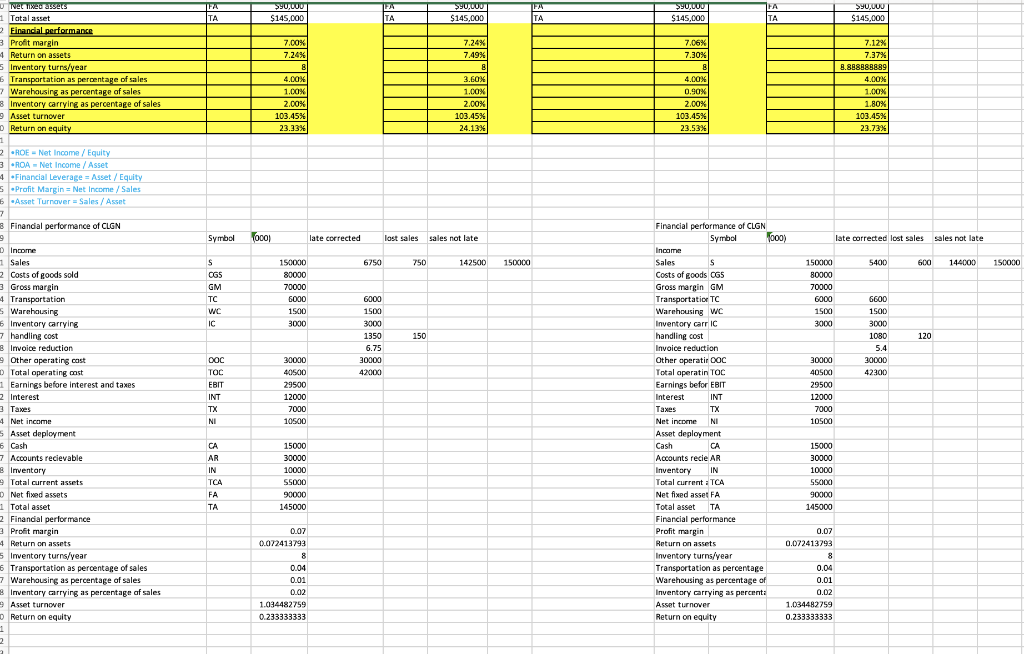
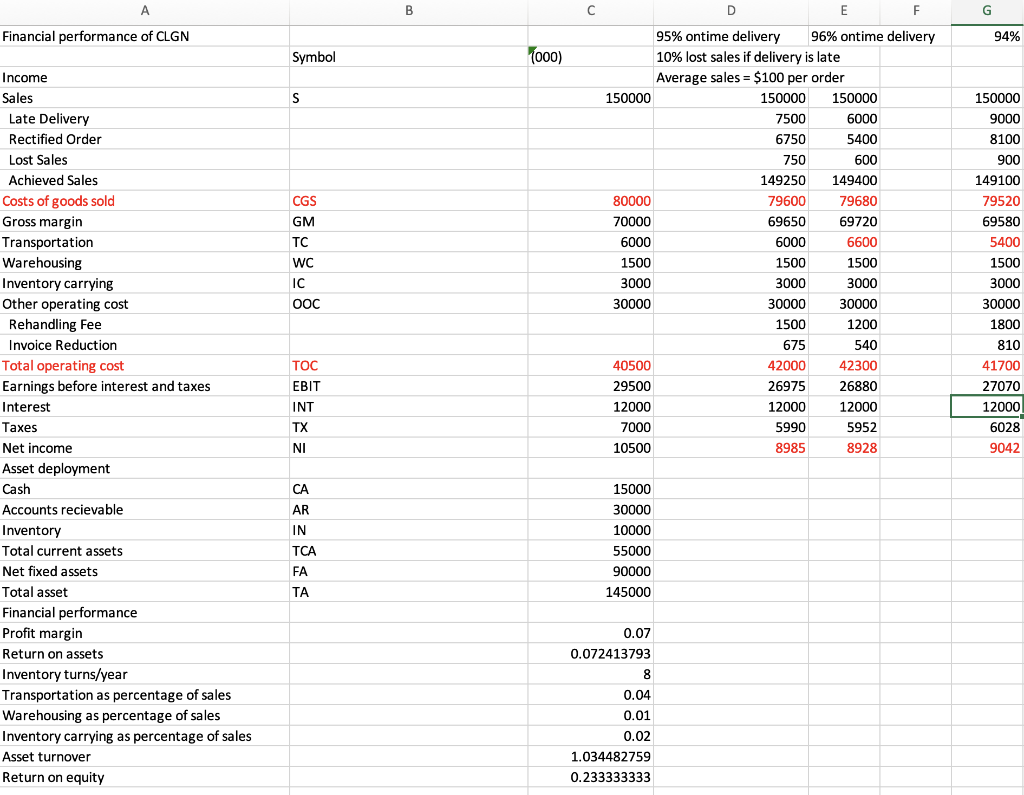
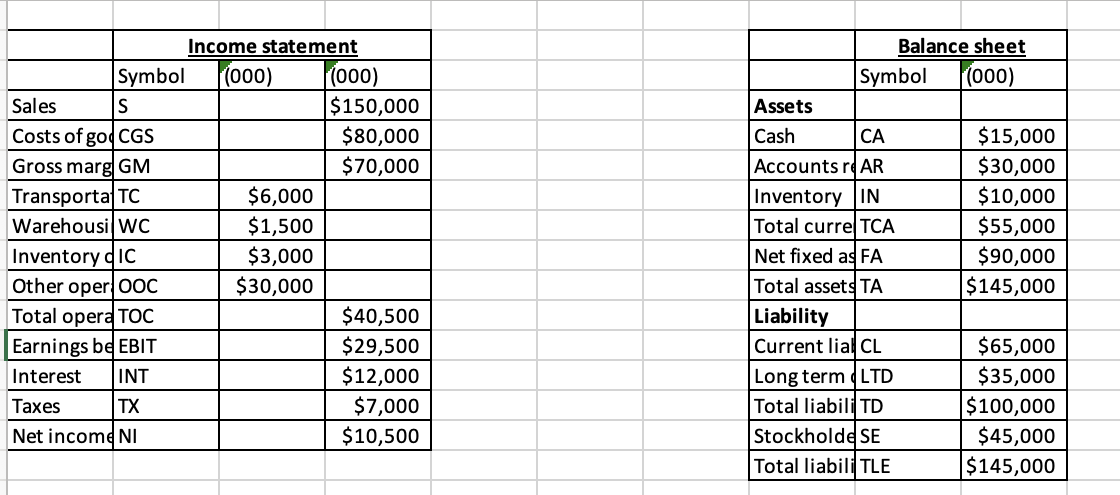
C D H K L M N 0 P Income statement 1000) 000) Balance sheet Symbol 1000) $150,000 $80,000 $70,000 Sales Costs of goods sold Gross margin Transportation Warehousing Inventory carrying Other operating cost Tatal operating cost Earnings before interest and taxes Interest Taxes Net income Symbal IS OGS GM TC WC IC OOC TOC EBIT INT TX NI $6,000 $1,500 $3,000 $30,000 Assets Cash Accounts redievable Inventory Total current assets Net fixed assets Total assets Lability Current liability Long term debit Total liability Stockholders' equity Total liabilities and equity CA AR IN | FA TA $15,000 $30,000 $10,000 $55,000 $90,000 $145,000 $40,500 $29,500 $12,000 $7,000 $10,500 a LTD TD SE TLE $65,000 $25.000 $100,000 $45,000 $145,000 10% reduction on warehousing cost 10% reduction on Inventory 10% reduction on transportation Symbol 10001 1000) Symbol 1000) Symbol |1000) $150,000 $80,000 $70,000 $6,000 $1.500 $3,000 $30,000 $40,500 $29,500 $12,000 $7,000 $10,500 IS OGS GM TC WC IC ood TOC EBT INT TX NI $150,000 $80,000 $70,000 $5,400 $1,500 $3,000 $30,000 $39,900 $30,100 $12,000 $7,240 $10,860 S OGS GM TC WC IC 000 $150,000 $80,000 $70,000 $6,000 $1,350 $3,000 $30,000 $40,350 $29,650 $12,000 $7,060 $10,590 S CGS GM TC WC IC - lood TOC EBIT INT TY $150,000 $80,000 $70,000 $6,000 $1,500 $2,700 $30,000 $40,200 $29,800 $12,000 $7,120 $10,680 TOC TOC EBIT INT TX NI NI Financial performance of CGN Symbol Income Sales IS Casts of goods sald OGS Gross margin GM Transportation TC Warehousing WC Inventory carrying IC Other operating cost OOC Total operating cost Earnings before interest and taxes ERIT Interest INT Taxes TX Net income NI Asset deployment Cash CA Accounts recievable JAR Inventory IN Total current assets TCA Net fixed assets FA Total asset TA Financial performance Profit margin Return on assets Inventory turns/year Transportation as percentage of sales Warehousing as percentage of sales Inventory carrying as percentage of sales Asset turnover Return on equity CA AR $15,000 $30,000 $10,000 $55,000 $90,000 $145,000 IN TCA FA $15,000 $30,000 $10,000 $55,000 $90,000 $145,000 CA AR IN TCA FA TA $15,000 $30,000 $10,000 $55,000 $90,000 $145,000 CA - AR IN TCA FA TA $15,000 $30,000 $9,000 $55,000 $90,000 $145,000 TA 7.00% 7.24% 8 4.00% 7.24% 7.49% 8 3.60% 1.00% 2.00% 103,45% 24.13% 7.06% 7.30% 8 4.00% 0.90% 2.00% 103.45% 23.53% 7.12% 7.37% 8.888888889 4.00% 1.00% 1.80% 103.45% 23.73% 1.00% 2.00% 103.45% 23.33% RCE Net Income / Equity -ROA = Net Income / Asset Financial Leverage Asset/Equity -Profit Margin = Net Income / Sales Asset Turnover Sales / Asset Financial performance of CGN Symbol Tooo) late corrected lost sales sales not late late corrected lost sales sales not late 6250 750 142500 150000 5400 600 144000 150000 Income Sales Casts of goods sold Gross margin Transportation Warehousing Inventory rarruine S OGS GM TC WC 150000 80000 70000 6000 1500 300 Financial performance of CIGN Symbol 1000) Income Sales S Costs of goods CGS Grass margin GM Transportatio TC Warehousing WC Inventory rare I 150000 80000 70000 6000 1500 3000 6000 1500 6600 1500 3000 200 TA TA $90,000 $145,000 FA ITA $90,000 $145,000 TF TA $90,000 $145,000 PA TA $90,000 $145,000 7.00% 7.24% 8 4.00% 1.00% 2.00% 103.45% 23.33% 7.24% 7.49% 8 3.60% 1.00% 2.00% 103.45% 24.13% 7.06% 7.30% 8 4.00% 0.90% 2.00% 103.45% % 23.53% 7.12% 7.37% 8.888888889 4.00% 1.00% 1.80% 103.45% 23.73% % Symbol ooo) late corrected lost sales sales not late 6750 750 142500 150000 150000 s OGS GM TC WC U Ne Teasers 1 Tatal asset Einancial performance 3 Profit margin 4 Return on assets Inventory turns/year Transportation as percentage of sales Warehousing as percentage of sales 8 Inventory carrying as percentage of sales Asset turnover Return on equity 1 ROE - Net Income / Equity 3 ROA - Net Income / Asset 4 Financial Leverage Asset/Equity S Profit Margin = Net Income / Sales b Asset Turnover Sales / Asset 7 8 & Financial performance of CLGN 9 Income 1 Sales Costs of goods sold 3 Gross margin 4 Transportation s Warehousing Inventory carrying 7 handling cost 8 Invoice reduction 9 Other operating cost Tatal operating cost 1 Earnings before interest and taxes 2 Interest 3 Taxes 4 Net income 5 Asset deployment 6 Cash 7 Accounts recievable 3 Inventory 9 Tatal current assets Net fixed assets 1 Total asset 2 Financial performance 3 Profit margin 4 Return on assets 5 Inventory turns/year 6 Transportation as percentage of sales 7 Warehousing as percentage of sales Inventary carrying as percentage of sales Asset turnover Return on equity 1 2 150000 80000 70000 6000 1500 3000 IC 6000 1500 3000 1350 6.75 30000 42000 150 OOC TOC EBIT INT TX 30000 40500 29500 12000 7000 10500 NI Financial performance of CLGN Symbol 000) late corrected lost sales sales not late Income Sales S 150000 5400 600 144000 Costs of goods OG5 80000 Gross margin GM 70000 Transportatic TC 6000 6600 Warehousing WC 1500 1500 Inventory carr IC 3000 3000 handling cost 1080 120 Invoice reduction 5.4 Other operatir OOC 30000 30000 Total aperatin TOC 40500 42300 Earnings befor EBIT 29500 Interest INT 12000 Taxes TX 7000 Net income NI 10500 Asset deployment Cash CA 15000 Accounts recie AR 30000 Inventory IN 10000 Total current - TCA 55000 Net fixed asset FA 90000 Total asset TA 145000 Financial performance Profit margin 0.07 Return on assets 0.072413793 Inventory turns/year 8 Transportation as percentage 0.04 Warehousing as percentage of 0.01 Inventory carrying as percent 0.02 Asset turnover 1.034482759 Return on equity 0.233333333 CA AR IN TCA FA 15000 30000 10000 55000 90000 145000 TA 0.07 0.072413793 8 8 0.04 0.01 0.02 1.034482759 0.233333333 B C G Financial performance of CLGN 94% Symbol (000) S CGS GM D D E F 95% ontime delivery 96% ontime delivery 10% lost sales if delivery is late Average sales = $100 per order 150000 150000 150000 7500 6000 6750 5400 750 600 149250 149400 80000 79600 79680 70000 69650 69720 6000 6000 6600 1500 1500 1500 3000 3000 3000 30000 30000 30000 1500 1200 675 540 40500 42000 42300 29500 26975 26880 12000 12000 12000 7000 5990 5952 10500 8985 8928 TC WC Income Sales Late Delivery Rectified Order Lost Sales Achieved Sales Costs of goods sold Gross margin Transportation Warehousing Inventory carrying Other operating cost Rehandling Fee Invoice Reduction Total operating cost Earnings before interest and taxes Interest Taxes Net income Asset deployment Cash Accounts recievable Inventory Total current assets Net fixed assets Total asset Financial performance Profit margin Return on assets Inventory turns/year Transportation as percentage of sales Warehousing as percentage of sales Inventory carrying as percentage of sales Asset turnover Return on equity 150000 9000 8100 900 149100 79520 69580 5400 1500 3000 30000 1800 810 41700 27070 12000 6028 9042 IC OOC TOC EBIT INT TX NI CA AR IN TCA 15000 30000 10000 55000 90000 145000 FA TA 0.07 0.072413793 8 0.04 0.01 0.02 1.034482759 0.233333333 m. Balance sheet Symbol (000) Sales Assets Cash CA Income statement Symbol (000) (000) S $150,000 Costs of god CGS $80,000 Gross marg GM $70,000 Transporta TC $6,000 Warehousi WC $1,500 Inventory IC $3,000 Other oper OOC $30,000 Total opera TOC $40,500 Earnings be EBIT $29,500 Interest INT $12,000 Taxes TX $7,000 Net income NI $10,500 $15,000 $30,000 $10,000 $55,000 $90,000 $145,000 Accounts re AR Inventory IN Total curre TCA Net fixed a FA Total assets TA Liability Current lialCL Long term LTD Total liabili TD Stockholde SE Total liabili TLE $65,000 $35,000 $100,000 $45,000 $145,000
Step by Step Solution
There are 3 Steps involved in it

Get step-by-step solutions from verified subject matter experts