Question: SOLVE WITH R. EXPLAIN THE CODES PLEASE. Q1) The book data contains prices paid for 60 used books at three different bookstores. The column dollars
 SOLVE WITH R. EXPLAIN THE CODES PLEASE.
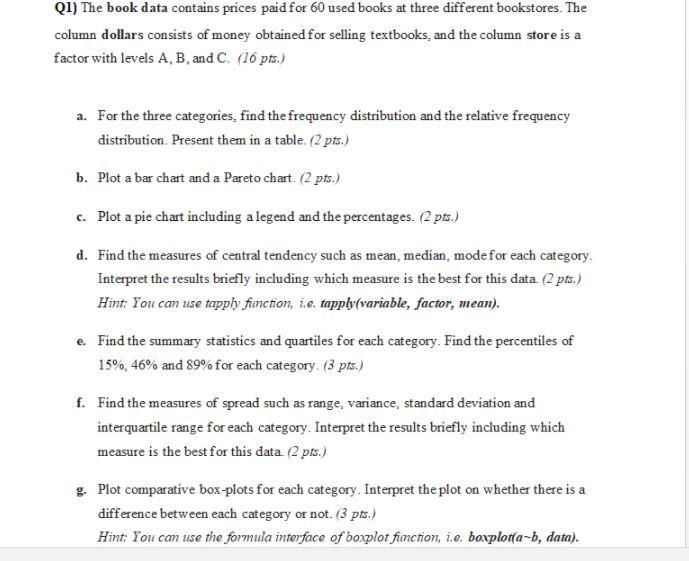
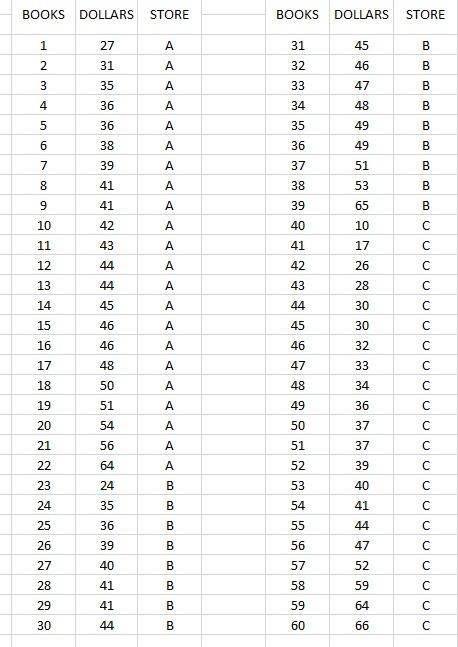
Q1) The book data contains prices paid for 60 used books at three different bookstores. The column dollars consists of money obtained for selling textbooks, and the column store is a factor with levels A, B, and C. (16 pts.) a. For the three categories, find the frequency distribution and the relative frequency distribution Present them in a table. (2 pts.) b. Plot a bar chart and a Pareto chart. (2 pts.) c. Plot a pie chart including a legend and the percentages. (2 pts.) d. Find the measures of central tendency such as mean, median, mode for each category. Interpret the results briefly including which measure is the best for this data (2 pts.) Hint: You can use tapply finction, ie tappb(variable, factor, mean). e. Find the summary statistics and quartiles for each category. Find the percentiles of 15% 46% and 89% for each category. (3 pts.) f. Find the measures of spread such as range, variance, standard deviation and interquartile range for each category. Interpret the results briefly including which measure is the best for this data (2 pts.) g. Plot comparative box-plots for each category. Interpret the plot on whether there is a difference between each category or not. (3 pts.) Hint: You can use the formula interface of boxplot function, i.e. boxplota-b, data). BOOKS DOLLARS STORE BOOKS DOLLARS STORE 1 27 31 45 B 2 31 32 46 B DDDD 3 35 33 47 00 00 4 36 34 48 5 36 A 35 49 B 6 38 A 36 49 B 7 39 A 37 51 B 41 A 38 53 B 8 9 41 A 39 65 B 10 42 A 40 10 C C 11 A 17 C 41 42 12 A 26 43 44 44 45 13 A 43 28 14 A 44 30 C 15 46 A 45 30 16 A 46 32 C 46 48 17 A 47 33 18 50 48 34 C 19 51 49 36 C 20 54 DDDDD 50 37 21 56 51 37 22 64 52 39 C 23 24 B 53 40 C 24 35 B 54 41 C 25 36 B 55 44 26 B 56 47 C 39 40 27 B 57 52 U U 28 41 B 58 59 29 41 B 59 64 C 30 44 B 60 66 C Q1) The book data contains prices paid for 60 used books at three different bookstores. The column dollars consists of money obtained for selling textbooks, and the column store is a factor with levels A, B, and C. (16 pts.) a. For the three categories, find the frequency distribution and the relative frequency distribution Present them in a table. (2 pts.) b. Plot a bar chart and a Pareto chart. (2 pts.) c. Plot a pie chart including a legend and the percentages. (2 pts.) d. Find the measures of central tendency such as mean, median, mode for each category. Interpret the results briefly including which measure is the best for this data (2 pts.) Hint: You can use tapply finction, ie tappb(variable, factor, mean). e. Find the summary statistics and quartiles for each category. Find the percentiles of 15% 46% and 89% for each category. (3 pts.) f. Find the measures of spread such as range, variance, standard deviation and interquartile range for each category. Interpret the results briefly including which measure is the best for this data (2 pts.) g. Plot comparative box-plots for each category. Interpret the plot on whether there is a difference between each category or not. (3 pts.) Hint: You can use the formula interface of boxplot function, i.e. boxplota-b, data). BOOKS DOLLARS STORE BOOKS DOLLARS STORE 1 27 31 45 B 2 31 32 46 B DDDD 3 35 33 47 00 00 4 36 34 48 5 36 A 35 49 B 6 38 A 36 49 B 7 39 A 37 51 B 41 A 38 53 B 8 9 41 A 39 65 B 10 42 A 40 10 C C 11 A 17 C 41 42 12 A 26 43 44 44 45 13 A 43 28 14 A 44 30 C 15 46 A 45 30 16 A 46 32 C 46 48 17 A 47 33 18 50 48 34 C 19 51 49 36 C 20 54 DDDDD 50 37 21 56 51 37 22 64 52 39 C 23 24 B 53 40 C 24 35 B 54 41 C 25 36 B 55 44 26 B 56 47 C 39 40 27 B 57 52 U U 28 41 B 58 59 29 41 B 59 64 C 30 44 B 60 66 C


