

Question: Solving Flair Furniture's LP problem using Excel's Solver command: Read the Flair Furniture Company Case, which starts in Chapter 7 , TABLE 2 , titled
Solving Flair Furniture's LP problem using Excel's Solver command: Read the Flair Furniture Company Case, which starts in Chapter TABLE titled "Flair Furniture Company Data," through the section noted as "Here is a complete mathematical statement of the LP problem" Skip the section on the "Graphical Solution to an LP Problem." Pick up reading again starting at section titled "Using Excel's Solver Command to Solve LP Problems" Develop a Linear Programming Model for the Flair Furniture Company's Problem: Within a new tab in your Excel Workbook prepare a spreadsheet for Excel Solver. IGNORE Use of Excel QM as referenced in the text. This will not apply since you have already installed Solver in Excel Follow the text reading and program items from below to complete your work. Program A: Input the Excel Data for the Flair Furniture Example. Program B: Enter the Formulas for the Flair Furniture Example. Program C: Create the Excel Spreadsheet for the Flair Furniture Example. Program D: Begin Solver in Excel Program E: Configure the Solver Parameters in the Solver Parameters Dialog Box. Program F: Confirm the Solver Parameters in the Solver Parameters Dialog Box.
Similarly, the second constraint is as follows:
Painting and varnishing time used Painting and varnishing time available
Here is a complete mathematical statement of the LP problem.
longrightarrow hours of painting and varnishing time
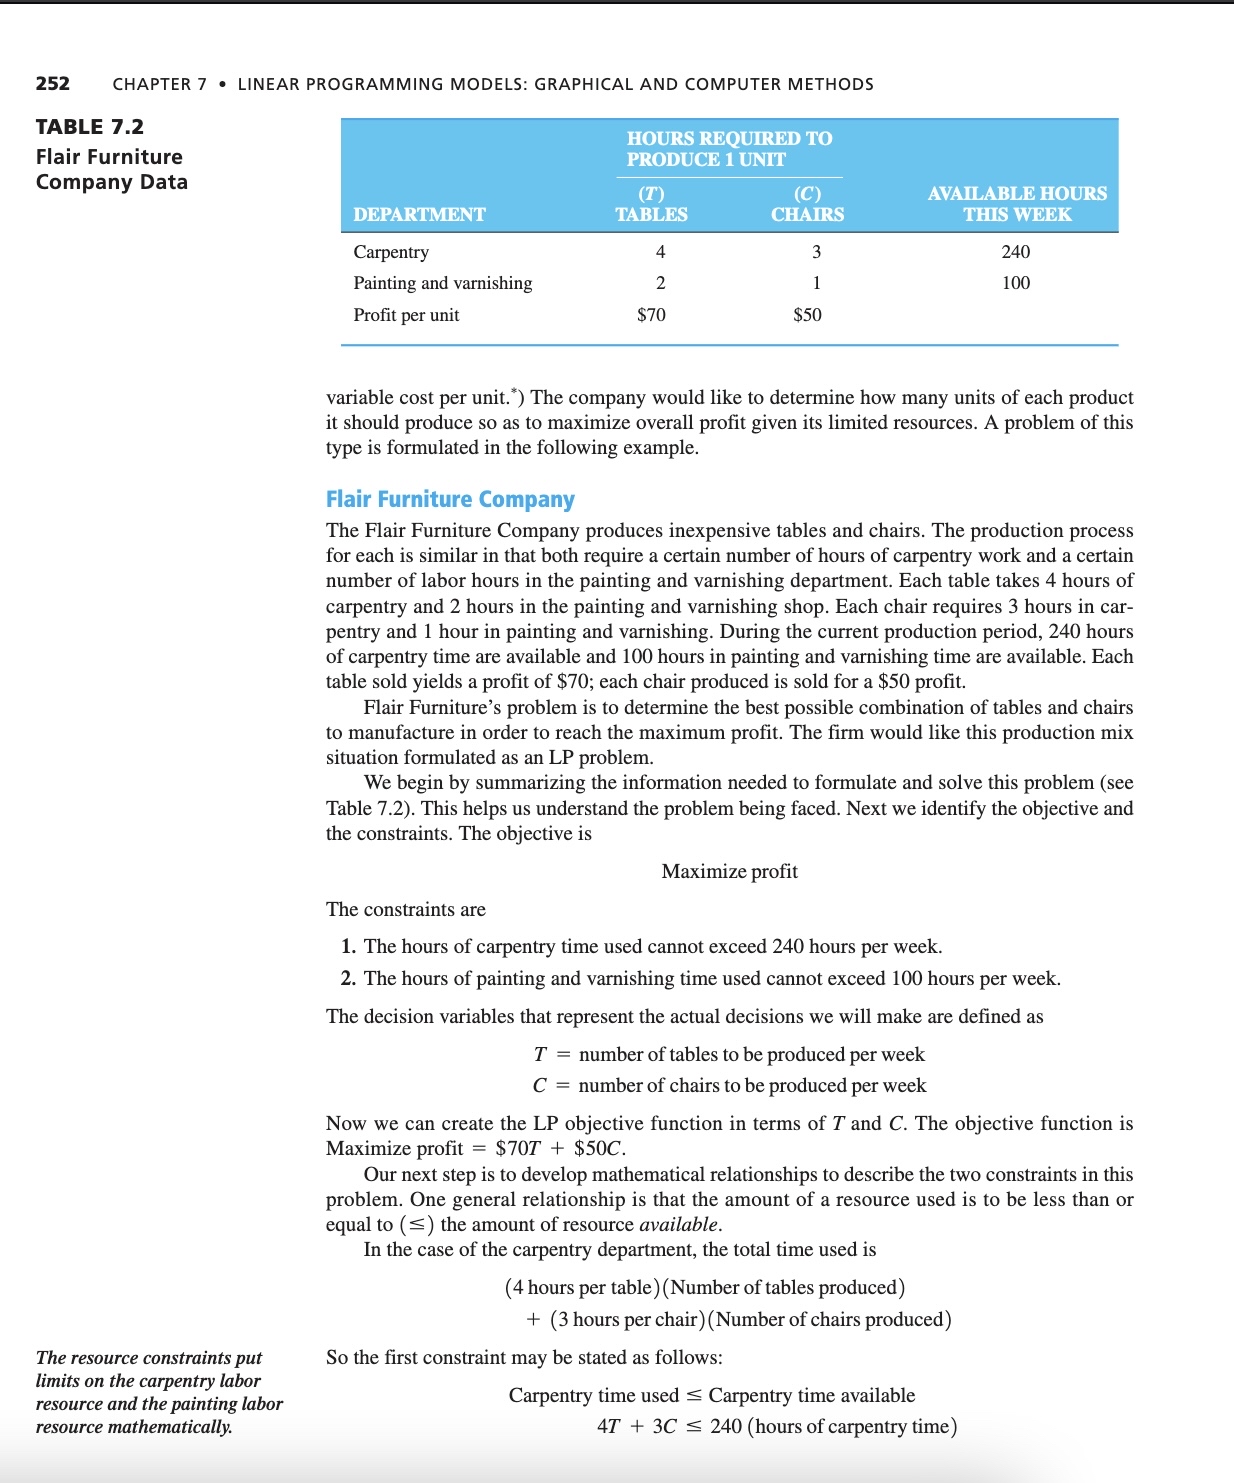
This means that each table produced takes two hours of the painting and varnishing resource.
Both of these constraints represent production capacity restrictions and, of course, affect the total profit. For example, Flair Furniture cannot produce tables during the production period because if both constraints will be violated. It also cannot make tables and chairs. Why? Because this would violate the second constraint that no more than hours of painting and varnishing time be allocated.
To obtain meaningful solutions, the values for and must be nonnegative numbers. That is all potential solutions must represent real tables and real chairs. Mathematically, this means that
tables produced greater than equal
chairs produced greater than euqal
The complete problem may now be restated mathematically as
Maximize profit $$
subject to the constraints
constraint
and varnishing constraint
nonnegativity constraint
nonnegativity constraint
While the nonnegativity constraints are technically separate constraints, they are often written on a single line with the variables separated by commas. In this example, this would be written as
Graphical Solution to an LP Problem
The graphical method works only when there are two decision variables, but it provides valuable insight into how larger problems are structured.
Nonnegativity constraints mean and
Plotting the first constraint involves finding points at which the line intersects the and axes.
The easiest way to solve a small LP problem such as that of the Flair Furniture Company is with the graphical solution approach. The graphical procedure is useful only when there are two decision variables such as number of tables to produce, and number of chairs to produce, in the problem. When there are more than two variables, it is not possible to plot the solution on a twodimensional graph and we must turn to more complex approaches. But the graphical method is invaluable in providing us with insights into how other approaches work. For that reason alone, it is worthwhile to spend the rest of this chapter exploring graphical solutions as an intuitive basis for the chapters on mathematical programming that follow.
Graphical Representation of Constraints
To find the optimal solution to an LP problem, we must first identify a set, or region, of feasible solutions. The first step in doing so is to plot each of the problem's constraints on a graph. The variable tables is plotted as the horizontal axis of the graph and the variable chairs is plotted as the vertical axis. The notation is used to identify the points on the graph. The nonnegativity constraints mean that we are always working in the first
Step by Step Solution
There are 3 Steps involved in it
1 Expert Approved Answer
Step: 1 Unlock

Question Has Been Solved by an Expert!
Get step-by-step solutions from verified subject matter experts
Step: 2 Unlock
Step: 3 Unlock