

Question: Someone please answer this question as soon as possible. Please. A. Comment on the following graphs and explain in details. (5) Data Set A (n
Someone please answer this question as soon as possible. Please.
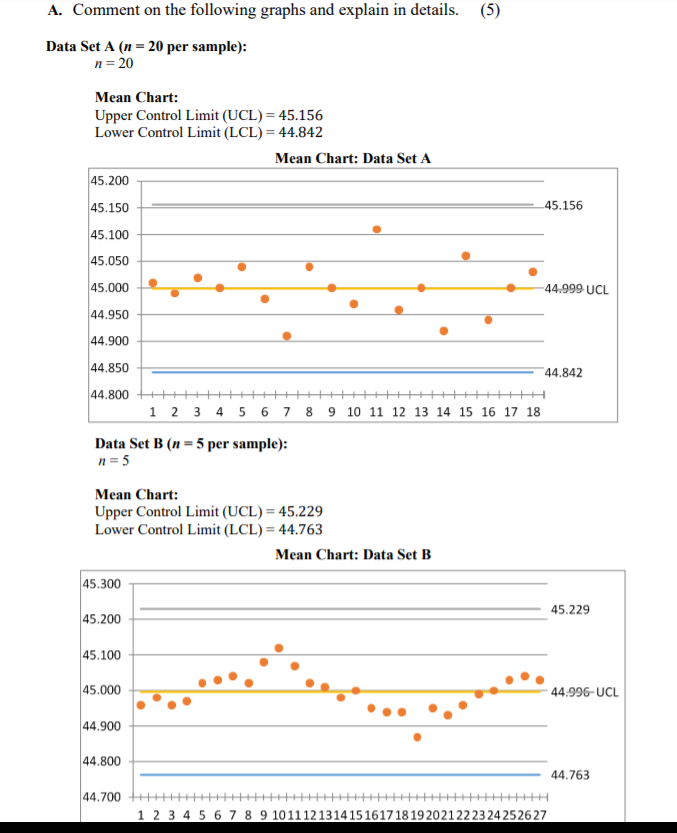
A. Comment on the following graphs and explain in details. (5) Data Set A (n = 20 per sample): n=20 Mean Chart: Upper Control Limit (UCL) = 45.156 Lower Control Limit (LCL) = 44.842 Mean Chart: Data Set A 45.200 45.150 45.100 45.156 45.050 45.000 -44.999 UCL 44.950 44.900 44.850 44.842 44.800 1 2 3 4 5 6 7 8 9 10 11 12 13 14 15 16 17 18 Data Set B (n = 5 per sample): n= 5 Mean Chart: Upper Control Limit (UCL) = 45.229 Lower Control Limit (LCL) = 44.763 Mean Chart: Data Set B 45.300 45.229 45.200 45.100 45.000 44.996-UCL 44.900 44.800 44.763 44.700 1 2 3 4 5 6 7 8 9 101112131415161718192021222324252627Step by Step Solution
There are 3 Steps involved in it
1 Expert Approved Answer
Step: 1 Unlock

Question Has Been Solved by an Expert!
Get step-by-step solutions from verified subject matter experts
Step: 2 Unlock
Step: 3 Unlock