

Question: someone please help me is additional NPV provided from refurbishment -10800? St. Germaine Industries is deciding whether to automate one phase of its production process.
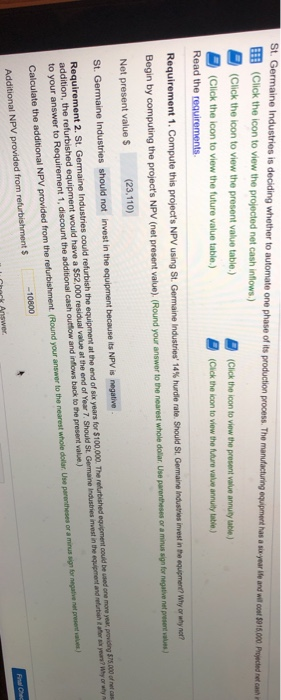
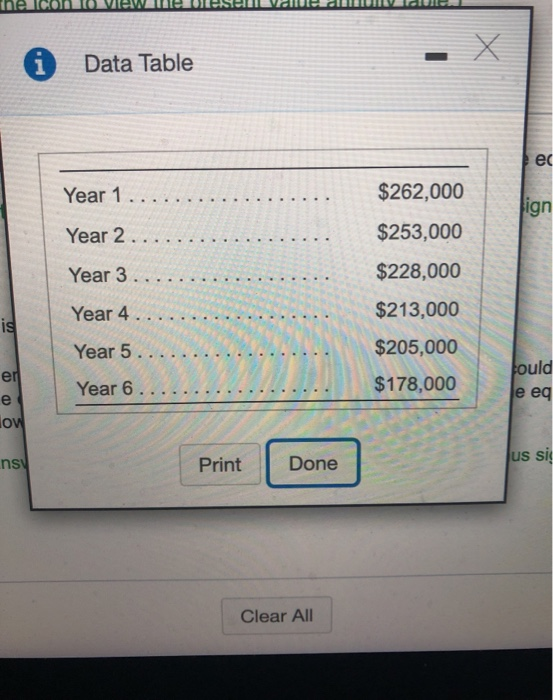
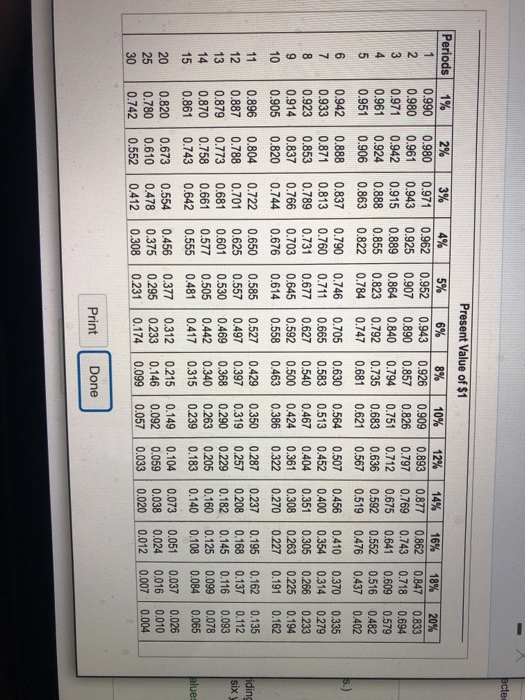
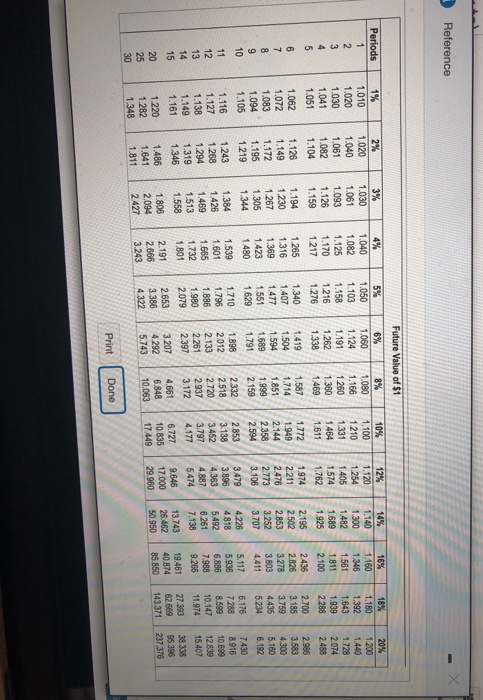
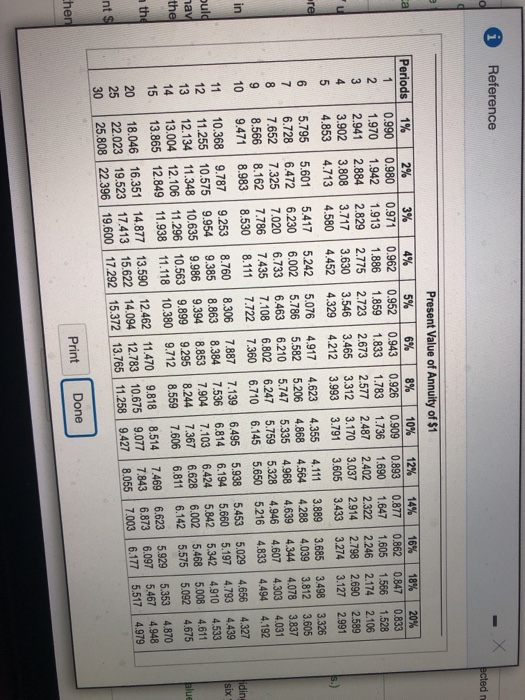
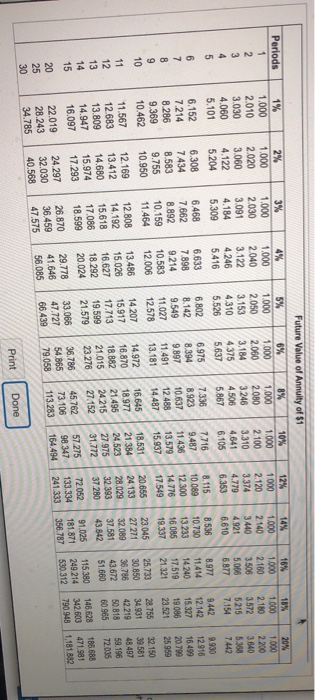
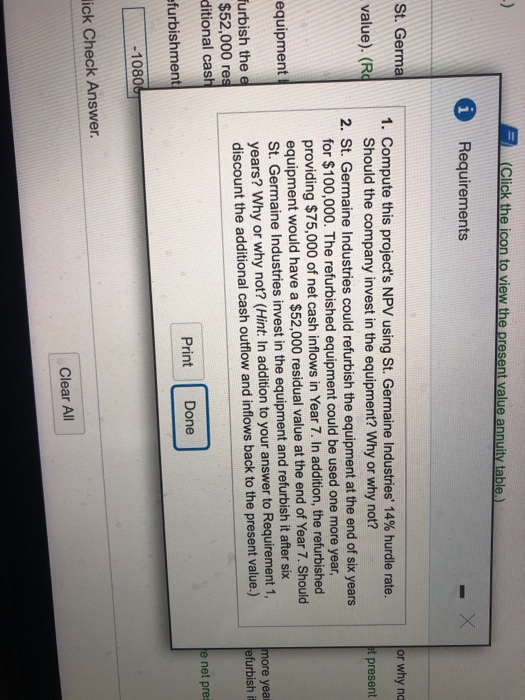
St. Germaine Industries is deciding whether to automate one phase of its production process. The manufacturing equipment has a six year ite and will cost $915.000 Precede 11: (Click the icon to view the projected net cash inflows.) (Click the icon to view the present value table.) (Click the icon to view the prosent value annuty table) (Click the icon to view the future value table.) (Click the icon to view the future value annuity table.) Read the requirements Requirement 1. Compute this project's NPV using St. Germaine Industries' 14% hurdle rate. Should St Germaine Industries invest in the equipment? Why or why not? Begin by computing the project's NPV (net present value). (Round your answer to the nearest whole dollar Use parentheses or a minus sign for negative not presentes) Net present value $ (23.110) St. Germaine Industries should not invest in the equipment because its NPV is negative you? Wyor why Requirement 2. St. Germaine Industries could refurbish the equipment at the end of six years for $100,000. The refurbished equipment could be used one more you providing so frecas regar addition, the refurbished equipment would have a $52,000 residual value at the end of Year7. Should St Germaine Industries invest in the equipment and return to to your answer to Requirement 1, discount the additional cash outflow and inflows back to the present value) Calculate the additional NPV provided from the refurbishment (Round your answer to the nearest whole dollar. Use parentheses or a must -10800 Final Che Additional NPV provided from refurbishment $ Chori Answer |LAI VII-IIIETIESHI a - i Data Table el $262,000 Year 1.. Year 2. lign Year 3 $253,000 $228,000 $213,000 $205,000 $178,000 Year 4 Year 5 Year 6. is er ould je eq ow ns Print Done jus si Clear All pcte Periods 1% 0.980 0.971 0.961 0.951 0.942 0.933 0.923 0.914 0.905 0.896 0.887 0.879 0.870 0.861 0.820 0.780 0.742 2% 3% 0.971 0.961 0.943 0.942 0.915 0.924 0.888 0.906 0.863 0.888 0.837 0.871 0.813 0.853 0.789 0.837 0.766 0.820 0.744 0.804 0.722 0.788 0.701 0.773 0.681 0.758 0.661 0.743 0.642 0.673 0.554 0.610 0.478 0.5520.412 4% 0.962 0.925 0.889 0.855 0.822 0.790 0.760 0.731 0.703 0.676 0.650 0.625 0.601 0.577 0.555 0.456 0.375 0.308 Present Value of $1 5% 6% 8% 10% 0.9520.943 0.926 0.909 0.907 0.890 0.857 0.826 0.864 0.840 0.794 0.751 0.823 0.792 0.735 0.683 0.784 0.747 0.681 0.621 0.746 0.705 0.630 0.564 0.711 0.665 0.583 0.513 0.677 0.627 0.540 0.467 0.645 0.592 0.500 0.424 0.614 0.558 0.463 0.386 0.585 0.527 0.429 0.350 0.557 0.497 0.397 0.319 0.530 0.4690.368 0.290 0.505 0.442 0.340 0.263 0.481 0.417 0.315 0.239 0.377 0.312 0.215 0.149 0.295 0.233 0.146 0.092 0.231 0.174 0.099 0.057 12% 0.893 0.797 0.712 0.636 0.567 0.507 0.452 0.404 0.361 0.322 0.287 0.257 0.229 0.205 0.183 0.104 0.059 0.033 14% 16% 0.8770 862 0.769 0.743 0.675 0.641 0.592 0.552 0.519 0.476 0.456 0.410 0.400 0.354 0.351 0.305 0.308 0.263 0.270 0.227 0.195 0.208 0.168 0.182 0.145 0.160 0.125 0.140 0.108 0.073 0.051 0.038 0.024 0.020 0.012 18% 0.847 0.718 0.609 0.516 0.437 0.370 0.314 0.266 0.225 0.191 0.162 0.137 0.116 0.099 0.084 0.037 0.016 0.007 20% 0.833 0.694 0.579 0.482 0.402 0.335 0.279 0.233 0.194 0.162 0.135 0.112 0.093 0.078 0.065 0.026 0.010 0.004 0.237 iding six alue: Print Done Reference Periods 12% 10% 1.100 1.346 1.561 1.811 2.100 1.728 2.074 1.360 2% 1.020 1.040 1.061 1.082 1.104 1.126 1.149 1.172 1.195 1.219 2488 2.986 2436 1% 1.010 1.020 1.030 1.041 1.051 1.062 1.072 1,083 1.094 1.105 1.116 1.127 1.138 1.149 1.161 1.220 1.282 1.348 go 3% 1.030 1,061 1.093 1.126 1.159 1.194 1.230 1.267 1.305 1.344 1.384 1.426 1.469 1.513 1.558 1.806 2.094 2.427 Future Value of $1 4% 15% 8% 1.040 1.050 1.060 1.080 1.082 1.103 1.124 1.166 1.125 1.158 1.191 1.260 1.170 1.216 1.262 1.217 1.276 1.338 1.469 1.265 1.340 1.419 1.316 1.407 1.504 1.369 1.477 1.594 1.851 1.423 1.551 1.689 1.480 1.629 1.791 2.159 1.539 1.710 1.898 2332 1.601 1.796 2.012 2.518 1.886 1.665 2.133 2.720 1.980 1.732 2937 2261 1801 2.079 2.397 3.172 2653 2.191 4.661 3.207 3.386 2 666 6.848 4292 43225.74310.063 15% 1.180 1.392 1.643 1.939 2.288 2.700 3.185 3.759 4435 5.234 6.176 7288 8.599 10.147 11.974 27.390 62.669 143371 2.594 2853 3.138 2.826 3.278 3803 4.411 5.117 5.936 6.886 7.988 9.266 19.461 40.874 85 850 1.243 1.268 1.294 1.319 1.346 1.486 1.641 1.811 3.583 4300 5.160 6.192 7.430 8.916 10.699 12839 15.407 38.338 95.396 237376 3.452 3.797 4.177 6.727 10.835 17.449 4.887 5474 9.646 17.000 29.960 KORS 3.243 Print Done 0 Reference Periods 1 2.673 18% 0.847 1.566 2.174 2.690 3.127 3.312 3.037 16% 0.862 1.605 2246 2.798 3.274 3.685 4.039 4.344 4.607 20% 0.833 1.528 2.106 2.589 2.991 3.326 3.605 3.837 4.917 4.111 1% 2% 3% 0.990 0.980 0.971 1.970 1.942 1.913 2.9412.8842.829 3.902 3.808 3.717 4.853 4.713 4.580 4.580 5.795 5.601 5.417 6.728 6.472 6.230 7.652 7.325 7.020 8.5668.1627 .786 9.471 8.983 8.530 10.368 9.787 9.253 11.255 10.575 9.954 12.134 11.348 10.635 13.004 12.106 11.296 13.865 12.849 11.938 18.046 16.351 14.877 22.023 19.523 17.413 25,808 22.396 19.600 Present Value of Annuity of $1 4% 5% 6% 8% 10% 12% 14% 0.962 0.952 0.943 0.926 0.909 0.893 0.877 1.886 1.859 1.833 1.783 1.736 1.690 1.647 2.775 2.723 2.577 2.487 2.4022.322 3.630 3.546 3.170 2.914 4.452 4.329 4.212 3.993 3.791 3.605 3.433 5.242 5.076 4.623 4.355 3.889 6.002 5.786 5.582 5.206 4.868 4.564 4.288 6.733 6.463 6.210 5.747 5.335 4.968 4.639 7.435 7.108 6.802 6.247 5.759 5.328 4.946 8.111 7.722 7.360 6.710 6.145 5.650 5216 8.760 8.306 7.887 7.139 6.495 5.938 5.453 9.385 8.863 8.384 7.536 6.814 6.194 5.660 9.986 9.394 8.853 7.904 7.103 6.424 5.842 10.563 9.899 9.295 8.244 7.367 6.628 6.002 11.118 10.380 9.712 8.559 7.606 6.811 6.142 13.590 12.462 11.470 9.818 8.514 7.469 15.622 14.094 12.783 10.675 9.077 7.843 13.765 17.292 15.372 11.258 7.003 9.4278.055 Coo 4.031 4834 5.029 5.197 5.342 5.468 5.575 5.929 6.097 6.177 4494 4.656 4.793 4.910 5.008 5.092 5.353 5.467 5517 4.192 4.327 4.439 4.533 4.611 4.675 4.870 4.948 4.979 6.623 6.875 Print Done 20% Periods 5% 1.000 2.160 3% 1.000 2.030 3.091 4.184 5.309 5215 7.154 1% 1.000 2.010 3.030 4.060 5.101 6.152 7.214 8.286 9.369 10.462 11.567 12.683 13.809 14.947 16.097 22.019 28.243 34.785 14.240 2% 1.000 2.020 3.060 4.122 5.204 6.308 7.434 8.583 9.755 10.950 12.169 13.412 14.680 15.974 17.293 24.297 32.030 40.568 4% 1.000 2.040 3.122 4246 5.416 6.633 7.898 9.214 10.583 12.006 13.486 15.026 16.627 18.292 6.468 7.662 8.892 10.159 11.464 12.808 14.192 Future Value of Annuity of $1 8% 10% 12% 1.000 1.000 1.000 1.000 1.000 1.000 2.0501 2.060 2080 2.100 2.1202 .140 3246 3.1533.184 3 .310 3.374 3440 4375 4310 4.506 4.779 4.921 6.353 5.867 5.526 6.610 6.105 5.637 7.336 6,802 6.975 8.536 8.115 7.716 8.394 9.487 8.923 8.142 10.08910730 13.233 12300 9.549 11.436 10.637 9.897 13.579 12.488 14.776 16.085 11.491 11.027 19.337 15.937 17.549 14.487 13.181 12.578 23.045 18.531 14.972 16.645 20.655 14 207 27 271 24.130 21.384 18.977 16.870 15.917 32.089 28.029 24523 21.495 18.882 17.713 32.393 27975 37.581 21.01524216 19.599 43.842 31.77237 280 23 278 21.579 27.152 72 052 57.275 45.762 33066 73.106 98.347 133.334 47.727 164.494 356.787 241.333 113 283 66.439 79.058 3.640 5,368 7442 9.930 12.916 16.499 20799 25.959 32.150 39,581 48497 59.196 72.035 185 688 28.755 15.618 36.786 43.672 51.660 115.380 42.219 50 818 60.965 146.628 342.603 790.948 20.024 17.086 18.599 26.870 36.459 47.575 91.025 181.871 38.786 471.981 1181882 29.778 5486 530.312 41.646 | 56.085 Print Done (Click the icon to view the present value annuity table.) i Requirements St. Germa value). (R or why no t present 1. Compute this project's NPV using St. Germaine Industries' 14% hurdle rate. Should the company invest in the equipment? Why or why not? 2. St. Germaine Industries could refurbish the equipment at the end of six years for $100,000. The refurbished equipment could be used one more year, providing $75,000 of net cash inflows in Year 7. In addition, the refurbished equipment would have a $52,000 residual value at the end of Year 7. Should St. Germaine Industries invest in the equipment and refurbish it after six years? Why or why not? (Hint: In addition to your answer to Requirement 1, discount the additional cash outflow and inflows back to the present value.) equipment more yea jefurbishi furbish the e $52,000 res ditional cash e net pre: Print Done efurbishment -10806 dick Check Answer. Clear All
Step by Step Solution
There are 3 Steps involved in it

Get step-by-step solutions from verified subject matter experts